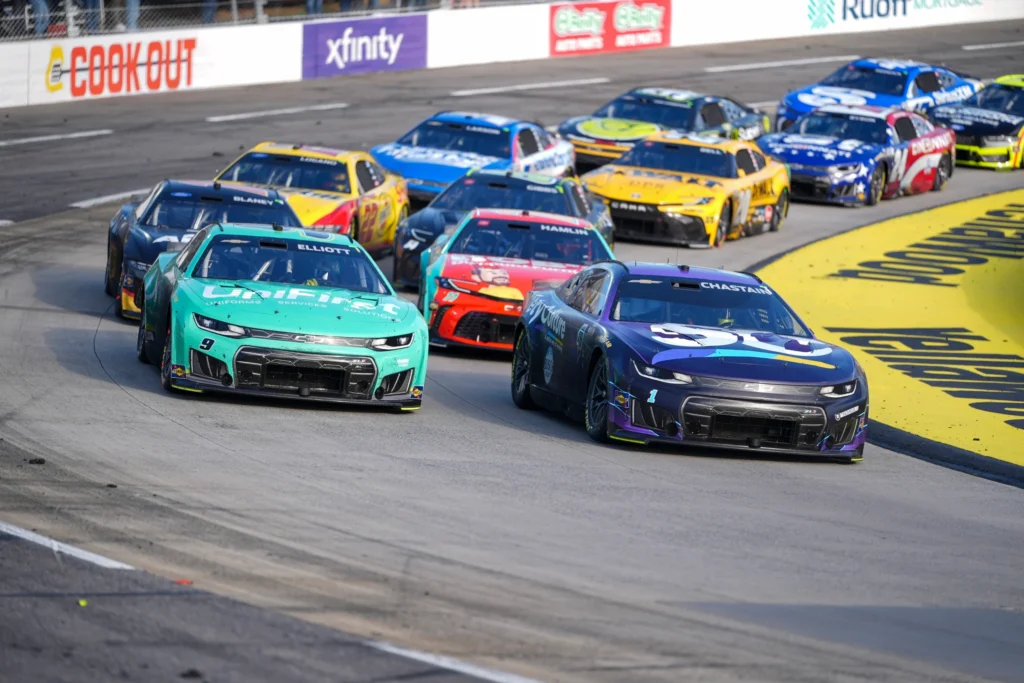
North Wilkesboro NASCAR 2026 Practice Results: Fastest Drivers and Full Speeds
Christopher Bell led the rain-delayed 50-minute session with an 18.222-second lap at 123.477 mph and swept every major long-run average from 10 through 30 laps.
The North Wilkesboro NASCAR 2026 practice results placed Christopher Bell at the top of both the single-lap and long-run charts. Bell completed the 0.625-mile oval in 18.222 seconds at 123.477 mph.
Denny Hamlin ranked second, only 0.014 second behind his Joe Gibbs Racing teammate. Ross Chastain was third and led the five-lap average before an inspection penalty changed his Sunday outlook.
Late-afternoon storms canceled qualifying. Therefore, practice speed did not decide the starting lineup. Ryan Blaney received the pole through NASCAR’s Rule Book, while Bell started third.
Christopher Bell was fastest. His official best lap was 18.222 seconds at 123.477 mph. He also led the 10-, 15-, 20-, 25- and 30-lap averages.
North Wilkesboro Practice Snapshot
123.477 mph
The No. 20 Toyota was quickest outright.
Short-run pace
The No. 1 Chevrolet owned the quickest opening sequence.
10 to 30 laps
Bell led every longer NASCAR average.
The session followed a long weather interruption. NASCAR originally scheduled Cup practice for 5 p.m. ET and qualifying for 6:10 p.m. ET.
However, storms arrived after the Truck Series race and delayed track activity. Once the surface dried, NASCAR used a 50-minute practice window instead of time trials.
The extra practice time created useful long-run data. Several teams completed enough consecutive laps to populate 25- and 30-lap average charts.
Official North Wilkesboro Practice Top 10
| Rank | Driver | Make | Best lap | Best speed | Gap |
|---|---|---|---|---|---|
| 1 | Christopher Bell | Toyota | 18.222 | 123.477 | Leader |
| 2 | Denny Hamlin | Toyota | 18.236 | 123.382 | +0.014 sec. |
| 3 | Ross Chastain | Chevrolet | 18.283 | 123.065 | +0.061 sec. |
| 4 | William Byron | Chevrolet | 18.320 | 122.817 | +0.098 sec. |
| 5 | Chase Elliott | Chevrolet | 18.321 | 122.810 | +0.099 sec. |
| 6 | Ty Gibbs | Toyota | 18.322 | 122.803 | +0.100 sec. |
| 7 | Kyle Larson | Chevrolet | 18.328 | 122.763 | +0.106 sec. |
| 8 | Josh Berry | Ford | 18.330 | 122.750 | +0.108 sec. |
| 9 | Joey Logano | Ford | 18.349 | 122.622 | +0.127 sec. |
| 10 | Chris Buescher | Ford | 18.364 | 122.522 | +0.142 sec. |
Bell and Hamlin gave Joe Gibbs Racing a one-two
Bell’s 18.222 led Hamlin’s 18.236 by fourteen thousandths of a second. The speed difference was 0.095 mph.
The gap was small enough to confirm that both JGR cars had immediate grip. However, Bell’s advantage grew more meaningful on the longer averages.
Chastain was the quickest Chevrolet
Chastain recorded an 18.283 at 123.065 mph. He ranked 0.061 second behind Bell and 0.047 behind Hamlin.
Meanwhile, Byron, Elliott and Larson placed fourth, fifth and seventh. Chevrolet put four cars inside the first seven positions.
Josh Berry led the Ford group
Berry’s 18.330 at 122.750 mph ranked eighth overall. Logano and Buescher followed in ninth and 10th.
Blaney was 11th. Therefore, the eventual pole winner was not the fastest Ford during practice.
The entire top 10 fit inside 0.142 second
Buescher’s 18.364 was only 0.142 second slower than Bell. On a 0.625-mile lap, that represented a compact leading group.
Nevertheless, small short-track gaps can become larger over a tire run. Bell’s average chart separated his complete performance from a simple one-lap result.
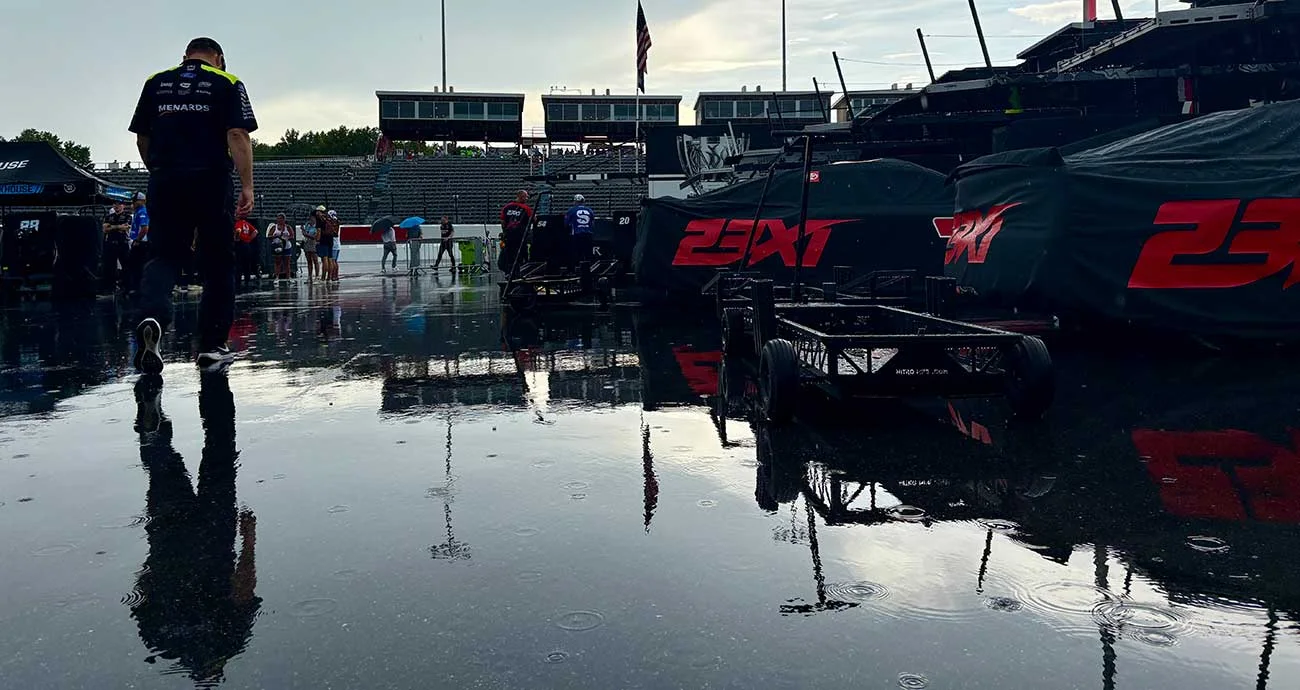
North Wilkesboro Full Practice Speeds
| Rank | Car | Driver | Make | NASCAR best lap | Speed mph |
|---|---|---|---|---|---|
| 1 | 20 | Christopher Bell | Toyota | 18.22 | 123.5 |
| 2 | 11 | Denny Hamlin | Toyota | 18.24 | 123.4 |
| 3 | 1 | Ross Chastain | Chevrolet | 18.28 | 123.1 |
| 4 | 24 | William Byron | Chevrolet | 18.32 | 122.8 |
| 5 | 9 | Chase Elliott | Chevrolet | 18.32 | 122.8 |
| 6 | 54 | Ty Gibbs | Toyota | 18.32 | 122.8 |
| 7 | 5 | Kyle Larson | Chevrolet | 18.33 | 122.7 |
| 8 | 21 | Josh Berry | Ford | 18.33 | 122.7 |
| 9 | 22 | Joey Logano | Ford | 18.35 | 122.6 |
| 10 | 17 | Chris Buescher | Ford | 18.36 | 122.5 |
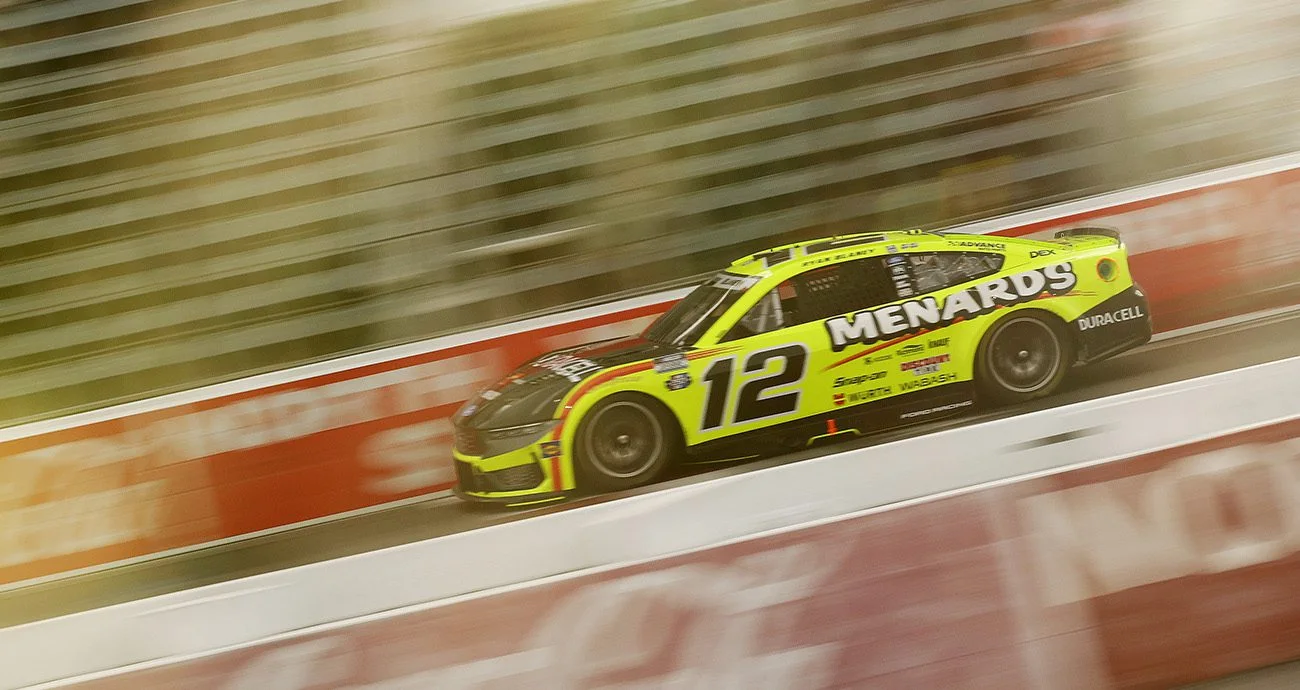
| 11 | 12 | Ryan Blaney | Ford | 18.38 | 122.4 |
| 12 | 2 | Austin Cindric | Ford | 18.39 | 122.3 |
| 13 | 88 | Connor Zilisch | Chevrolet | 18.40 | 122.3 |
| 14 | 35 | Riley Herbst | Toyota | 18.40 | 122.3 |
| 15 | 77 | Carson Hocevar | Chevrolet | 18.41 | 122.2 |
| 16 | 48 | Alex Bowman | Chevrolet | 18.41 | 122.2 |
| 17 | 97 | Shane van Gisbergen | Chevrolet | 18.42 | 122.1 |
| 18 | 23 | Bubba Wallace | Toyota | 18.43 | 122.1 |
| 19 | 7 | Daniel Suárez | Chevrolet | 18.43 | 122.1 |
| 20 | 34 | Todd Gilliland | Ford | 18.44 | 122.0 |
| 21 | 60 | Ryan Preece | Ford | 18.47 | 121.8 |
| 22 | 3 | Austin Dillon | Chevrolet | 18.47 | 121.8 |
| 23 | 38 | Zane Smith | Ford | 18.48 | 121.8 |
| 24 | 42 | John Hunter Nemechek | Toyota | 18.48 | 121.8 |
| 25 | 41 | Cole Custer | Chevrolet | 18.49 | 121.7 |
| 26 | 43 | Erik Jones | Toyota | 18.49 | 121.7 |
| 27 | 71 | Michael McDowell | Chevrolet | 18.50 | 121.6 |
| 28 | 19 | Chase Briscoe | Toyota | 18.51 | 121.6 |
| 29 | 47 | Ricky Stenhouse Jr. | Chevrolet | 18.54 | 121.4 |
| 30 | 16 | AJ Allmendinger | Chevrolet | 18.55 | 121.3 |
| 31 | 45 | Tyler Reddick | Toyota | 18.58 | 121.1 |
| 32 | 4 | Noah Gragson | Ford | 18.59 | 121.0 |
| 33 | 6 | Brad Keselowski | Ford | 18.61 | 120.9 |
| 34 | 33 | Austin Hill | Chevrolet | 18.61 | 120.9 |
| 35 | 10 | Ty Dillon | Chevrolet | 18.63 | 120.8 |
| 36 | 51 | Cody Ware | Chevrolet | 18.64 | 120.7 |
| 37 | 66 | Chad Finchum | Ford | 19.13 | 117.6 |
The full-field table uses NASCAR’s published best-lap order and rounded lap times. The mph column is calculated from the 0.625-mile track length and displayed to one decimal.
That presentation preserves the official ranking while keeping the long table readable. The exact NASCAR top-10 speeds appear in the earlier table.
Positions 11 through 18 remained close to the leaders
Blaney, Cindric, Zilisch, Herbst, Hocevar, Bowman, SVG and Wallace all remained within roughly two tenths of Bell.
This group contained several drivers with favorable starting positions. Blaney started first, Hocevar fourth and SVG eighth.
The middle order showed limited separation
Suárez through Jones ran between 18.43 and 18.49 seconds. Consequently, traffic and tire management mattered more than a few hundredths.
Preece and Austin Dillon shared an 18.47 rounded best lap. Zane Smith and Nemechek both appeared at 18.48.
The lower section still completed meaningful work
McDowell through Ware fell between 18.50 and 18.64 seconds. Finchum’s 19.13 completed the 37-car order.
Practice rank alone did not define every team’s goal. Some crews used the session to study tire falloff, brake temperature or balance changes rather than chase a fresh-tire lap.
Average speed = 0.625 mile × 3,600 ÷ lap timeBell’s 18.222-second lap produces 123.477 mph. This is the same official speed reported by NASCAR.
Why Christopher Bell Was the Practice Benchmark
The first-place lap was only the opening signal
A practice leaderboard can overvalue one fresh-tire lap. Bell removed that concern by remaining first as the run length increased.
The No. 20 led the 10-, 15-, 20-, 25- and 30-lap averages. Therefore, its advantage survived beyond the opening laps.
Long-run consistency matched the race format
The Window World 450 covered 450 laps and 281.25 miles. It was much longer than the recent All-Star exhibitions at North Wilkesboro.
A car that remained balanced for 30 laps offered more race-day value than one that peaked for a single lap. Bell supplied both qualities.
Previous track performance supported the data
Bell had won the 2025 All-Star Race at the same track. His 2026 practice result extended that North Wilkesboro record.
The track had changed from an exhibition setting to a points race. Still, the mechanical-grip requirements remained familiar.
The canceled qualifying session limited the reward
Bell did not receive the pole for leading practice. NASCAR set the grid through the Rule Book after weather canceled qualifying.
He started third behind Blaney and Gibbs. Even so, that position kept him close to clean air and early stage points.
Bell was the only driver who owned the fastest single lap and the complete 10-to-30-lap profile.
North Wilkesboro Long-Run Averages
| Average category | Leader | What it indicated |
|---|---|---|
| 5-lap average | Ross Chastain | Best short-run sequence |
| 10-lap average | Christopher Bell | First sustained-run benchmark |
| 15-lap average | Christopher Bell | Balance remained stable |
| 20-lap average | Christopher Bell | Strong tire-life signal |
| 25-lap average | Christopher Bell | Clear late-run control |
| 30-lap average | Christopher Bell | Best complete race-run profile |
Chastain owned the five-lap average
Chastain’s five-lap result supported his third-place single-lap speed. The No. 1 Chevrolet reached competitive pace quickly.
That profile would normally make a driver dangerous on restarts. However, the inspection penalty changed his opening assignment.
Bell took control after the first five laps
Bell led every listed average from 10 through 30 laps. The pattern showed that his car lost less performance as the tire aged.
It also suggested a stable balance. A car that becomes severely tight or loose normally drops down the longer-average order.
Larson remained close on long runs
NASCAR’s fantasy analysis identified Larson as the closest sustained-run challenger to Bell. The No. 5 had enough pace for a leading prediction.
However, the rainout placed Larson 27th. That created a major gap between practice potential and starting position.
Why the 30-lap average mattered
A 30-lap run covered 18.75 miles at North Wilkesboro. That sample exposed tire wear, balance drift and traffic sensitivity more clearly than a short sequence.
The average was not a guaranteed race forecast. Track temperature, rubber buildup and adjustments could alter the order.
Still, Bell’s leadership across every category made him the clearest practice-based favorite.
Team and Manufacturer Practice Analysis
Fastest driver by manufacturer
| Manufacturer | Fastest driver | Rank | Speed | Broader result |
|---|---|---|---|---|
| Toyota | Christopher Bell | 1st | 123.477 mph | Bell and Hamlin placed first and second; Gibbs was sixth |
| Chevrolet | Ross Chastain | 3rd | 123.065 mph | Byron, Elliott and Larson also ranked inside the top seven |
| Ford | Josh Berry | 8th | 122.750 mph | Logano and Buescher completed the top 10 |
Team groupings
| Organization | Practice ranks | Drivers | Session reading |
|---|---|---|---|
| Joe Gibbs Racing | 1st, 2nd, 6th | Bell, Hamlin and Gibbs | Best three-car combination |
| Hendrick Motorsports | 4th, 5th, 7th, 16th | Byron, Elliott, Larson and Bowman | Three cars within 0.106 second |
| Trackhouse Racing | 3rd, 13th, 17th, 19th | Chastain, Zilisch, SVG and Suárez | Excellent short-run speed, but inspection changed Chastain’s race outlook |
| Team Penske | 9th, 11th, 12th | Logano, Blaney and Cindric | All three Fords within the top 12 |
| RFK Racing | 10th, 21st, 33rd | Buescher, Preece and Keselowski | Buescher supplied the clear benchmark |
Joe Gibbs Racing had the best front-end depth
Bell and Hamlin occupied the first two positions. Gibbs added sixth, only 0.100 second from the lead.
Briscoe ranked 28th on the single-lap sheet. Nevertheless, one weaker fresh-tire result did not erase the organization’s strong leading cars.
Hendrick Motorsports had three clear contenders
Byron, Elliott and Larson placed fourth, fifth and seventh. Their times were separated by only eight thousandths.
Bowman ranked 16th. The team entered Sunday with speed, but only Elliott started inside the top 10 among its four drivers.
Ford’s quickest car came from Wood Brothers Racing
Berry ranked eighth and became the first Ford on the board. Logano, Buescher, Blaney and Cindric followed between ninth and 12th.
The group suggested competitive depth rather than one dominant Ford. Five Ford drivers occupied five consecutive positions from eighth through 12th except for the manufacturer mix around them.
Trackhouse produced speed and complications
Chastain ranked third and led the five-lap average. Zilisch was 13th, SVG 17th and Suárez 19th.
However, inspection failures affected Chastain, Zilisch and Austin Hill. The penalty story became inseparable from the speed story.
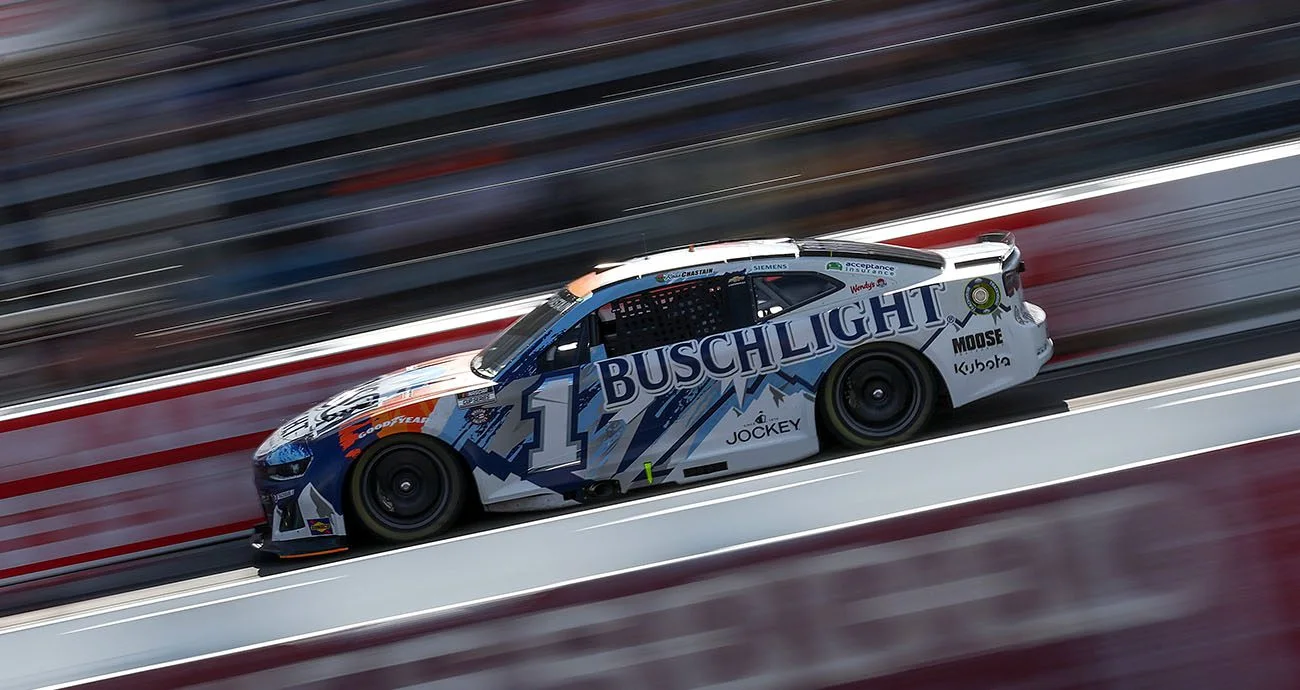
Rain Delayed Practice and Canceled Qualifying
Late-afternoon storms moved across the Wilkes County short track after the Truck Series race. The rain lingered long enough to remove the scheduled Cup qualifying session.
Track-drying work continued into the early evening. NASCAR then held an extended 50-minute practice once conditions became suitable.
The rain created more practice data
The original weekend format included a shorter practice and a separate qualifying session. Replacing time trials gave teams a longer continuous practice window.
Consequently, Bell and other drivers completed runs long enough for 25- and 30-lap averages. That produced more race-pace evidence than a normal short session.
The track surface was not static
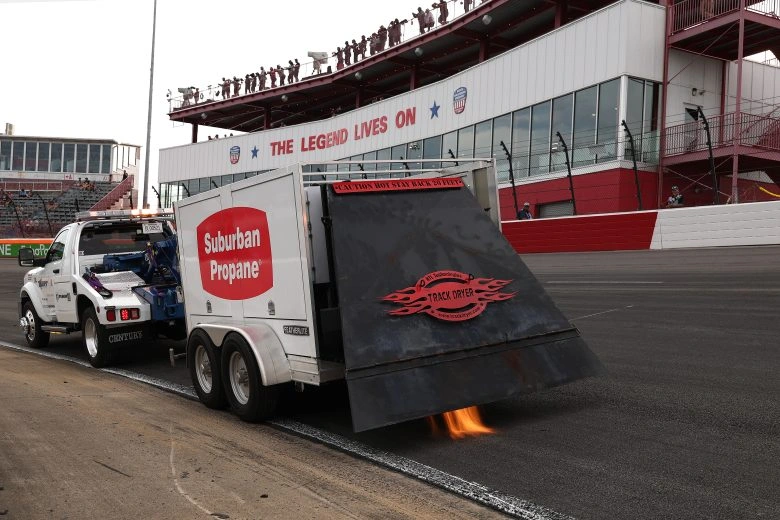
The rain cleaned rubber from parts of the groove. Jet dryers and support vehicles then prepared the surface before Cup cars ran.
As rubber returned, grip levels changed. Teams had to compare early laps against later runs rather than treat the entire session as one condition.
Practice speed and starting position became separate stories
Bell was quickest but started third. Hamlin was second fastest but started seventh.
Meanwhile, Blaney ranked 11th in practice and received the pole. The rainout made the Rule Book metric more important than one-lap practice rank.
Practice Results Versus the Starting Lineup
| Driver | Practice result | Starting position | Key difference |
|---|---|---|---|
| Ryan Blaney | 11th in practice | 1st start | Pole set through the NASCAR Rule Book |
| Ty Gibbs | 6th in practice | 2nd start | Front-row position despite not leading practice |
| Christopher Bell | 1st in practice | 3rd start | Fastest car did not receive the pole |
| Denny Hamlin | 2nd in practice | 7th start | Strong speed with manageable track position |
| Kyle Larson | 7th in practice | 27th start | Largest speed-to-grid mismatch among leading cars |
| Ross Chastain | 3rd in practice | Rear plus pass-through | Three inspection failures overrode his listed 13th start |
Blaney received track position without leading practice
Blaney’s recent EchoPark victory helped place him first under the rainout formula. He ranked 11th on practice speed.
The pole still carried real value. North Wilkesboro’s short lap makes clean air and early traffic control important.
Bell kept a favorable position
Starting third limited the damage from losing qualifying. Bell remained close enough to attack the leaders during Stage 1.
Gibbs started beside Blaney. Therefore, JGR placed two cars in the first three positions despite the canceled session.
Larson faced the largest recovery job
Larson ranked seventh in single-lap speed and remained close to Bell over long runs. He started 27th.
The 20-position gap created traffic risk. It also made Larson one of the clearest place-differential choices for fantasy formats.
Chastain’s penalty overrode his speed
Chastain was listed 13th under the Rule Book. Three inspection failures required him to drop to the rear and serve a pass-through after the green flag.
His third-place practice speed and leading five-lap average showed the car’s potential. However, the penalty threatened to place him a lap down immediately.
Practice results did not function as qualifying
NASCAR did not promote Bell to the pole or reorder the field through the speed chart. The official lineup followed the sanctioning body’s rainout procedure.
This distinction matters for search readers. “Fastest in practice” and “pole winner” described different drivers at North Wilkesboro.
Driver-by-Driver Practice Takeaways
Denny Hamlin: the safest alternative to Bell
Hamlin missed the top spot by 0.014 second. He also carried a seventh-place starting position.
That combination reduced his early traffic exposure. The No. 11 had both single-lap pace and a manageable route to the leaders.
Ross Chastain: speed with severe strategic damage
Chastain was third overall and first on the five-lap average. Few cars reached competitive pace more quickly.
Nevertheless, the pass-through penalty changed the race plan. The team needed a caution or exceptional long-run speed to recover the lost lap.
William Byron and Chase Elliott: nearly identical
Byron’s 18.320 edged Elliott’s 18.321 by one thousandth. Their speeds differed by only 0.007 mph.
Elliott started 10th, while Byron started 15th. Both had a realistic top-five practice profile.
Ty Gibbs: strong speed and front-row track position
Gibbs ranked sixth at 122.803 mph and started second. That was one of the weekend’s best combinations.
The No. 54 could use clean air immediately rather than spend Stage 1 passing slower cars.
Kyle Larson: high ceiling and high risk
Larson ranked seventh and remained close to Bell on the longer runs. His 27th start created the session’s most obvious speed-to-grid imbalance.
A clean first stage could turn the No. 5 into a contender. Contact or an untimely caution could erase the advantage.
Josh Berry: the quiet Ford leader
Berry ranked eighth and beat every other Ford on single-lap speed. His short-track background strengthened the result.
However, he started 28th. Like Larson, Berry needed patience through traffic.
Joey Logano and Chris Buescher: top-10 Ford stability
Logano ranked ninth and Buescher 10th. Both started near the front half of the field.
Their profiles lacked Bell’s long-run headline. Still, each had enough speed to remain relevant through strategy and track position.
How NASCAR Practice Speeds Are Calculated
North Wilkesboro Speedway is officially measured at 0.625 mile. A driver’s average lap speed uses distance divided by elapsed time.
Because lap time is measured in seconds, the calculation multiplies the track length by 3,600. The result is then divided by the lap time.
0.625 × 3,600 ÷ 18.222 = 123.477 mphThe formula reproduces Bell’s official NASCAR speed. It measures average speed around the complete lap, not the car’s maximum straightaway speed.
Why a tiny time gap changes the speed
Hamlin’s lap was 0.014 second slower than Bell’s. That small time difference reduced his average speed by 0.095 mph.
At a short oval, thousandths matter because the lap lasts only slightly more than 18 seconds.
Why one-lap speed can mislead
A team may set its best lap on fresher tires, with less traffic or during a more favorable track condition. Another team may prioritize a long run.
Therefore, the overall leaderboard should be read beside the lap-average chart. Bell led both, which made his session unusually convincing.
Five Practice Takeaways
1. Bell owned the most complete speed profile
He led the official lap and every average from 10 to 30 laps. No rival matched that combination.
2. Hamlin kept JGR firmly in control
Hamlin was only 0.014 second behind. Gibbs added sixth and a front-row start.
3. Chastain’s penalty wasted valuable track position
Third overall and first on five-lap average normally creates a winning outlook. The pass-through changed the calculation.
4. Larson and Berry offered major recovery potential
Both ranked inside the top eight but started 27th and 28th. Their first stage carried more risk than their practice pace suggested.
5. Rain produced better long-run evidence
The extended 50-minute session allowed teams to complete deeper runs. As a result, readers received more than a basic one-lap chart.
North Wilkesboro NASCAR 2026 Practice Results FAQ
Conclusion: Bell Led Every Practice Test That Mattered
The North Wilkesboro NASCAR 2026 practice results placed Bell first with an 18.222 at 123.477 mph. Hamlin and Chastain completed the leading three.
Bell’s single-lap result was only part of the story. He also led every official average from 10 through 30 laps.
Chastain supplied the strongest short-run alternative by leading the five-lap average. However, his inspection penalty changed the practical value of that speed.
Byron, Elliott and Larson gave Chevrolet deep pace near the front. Berry led Ford, followed by Logano and Buescher.
The weather created an unusual session. Qualifying disappeared, practice expanded to 50 minutes and NASCAR set the lineup through the Rule Book.
Therefore, Bell was the fastest driver without becoming the pole winner. The official sheet still made him the clearest practice benchmark for the historic Window World 450 weekend.
Sources & Official References
- NASCAR — official practice results, lap averages and lap times
- NASCAR — top-10 practice speeds and long-run leaders
- NASCAR — weather delay, 50-minute practice and qualifying cancellation
- NASCAR — Chastain, Zilisch and Hill inspection penalties
The top-10 table reproduces NASCAR’s exact published times and speeds. The full-field mph values are calculated to one decimal from NASCAR’s rounded best-lap times and the official 0.625-mile track length.