How Fast Do F1 Cars Go?
Top Speed, 0–60 & Why They’re So Quick
The official race speed record is 372.6 km/h (231.5 mph) — set by Juan Pablo Montoya at Monza in 2005. But that number alone doesn’t tell the whole story. Here is the complete breakdown: every record, the four forces that make F1 cars impossibly fast, track-by-track speed data, the DRS effect, and how they compare to IndyCar, NASCAR and MotoGP.
How Fast Do F1 Cars Go?
Top Speed, 0–60 & Every Record
Official records, acceleration data, track-by-track speeds and why F1 cars are the fastest road-circuit machines ever built.
A Formula 1 car can go from 0 to 200 km/h (124 mph) in under five seconds. It can then brake from 300 km/h (186 mph) back to 60 km/h (37 mph) in just over two seconds — while the driver absorbs 6G of deceleration, pushing the equivalent of six times their body weight through the brake pedal with over 160 kg (350 lbs) of force. The car doesn’t just go fast. It accelerates fast, stops fast, corners fast, and then does it all again 55 laps in a row.
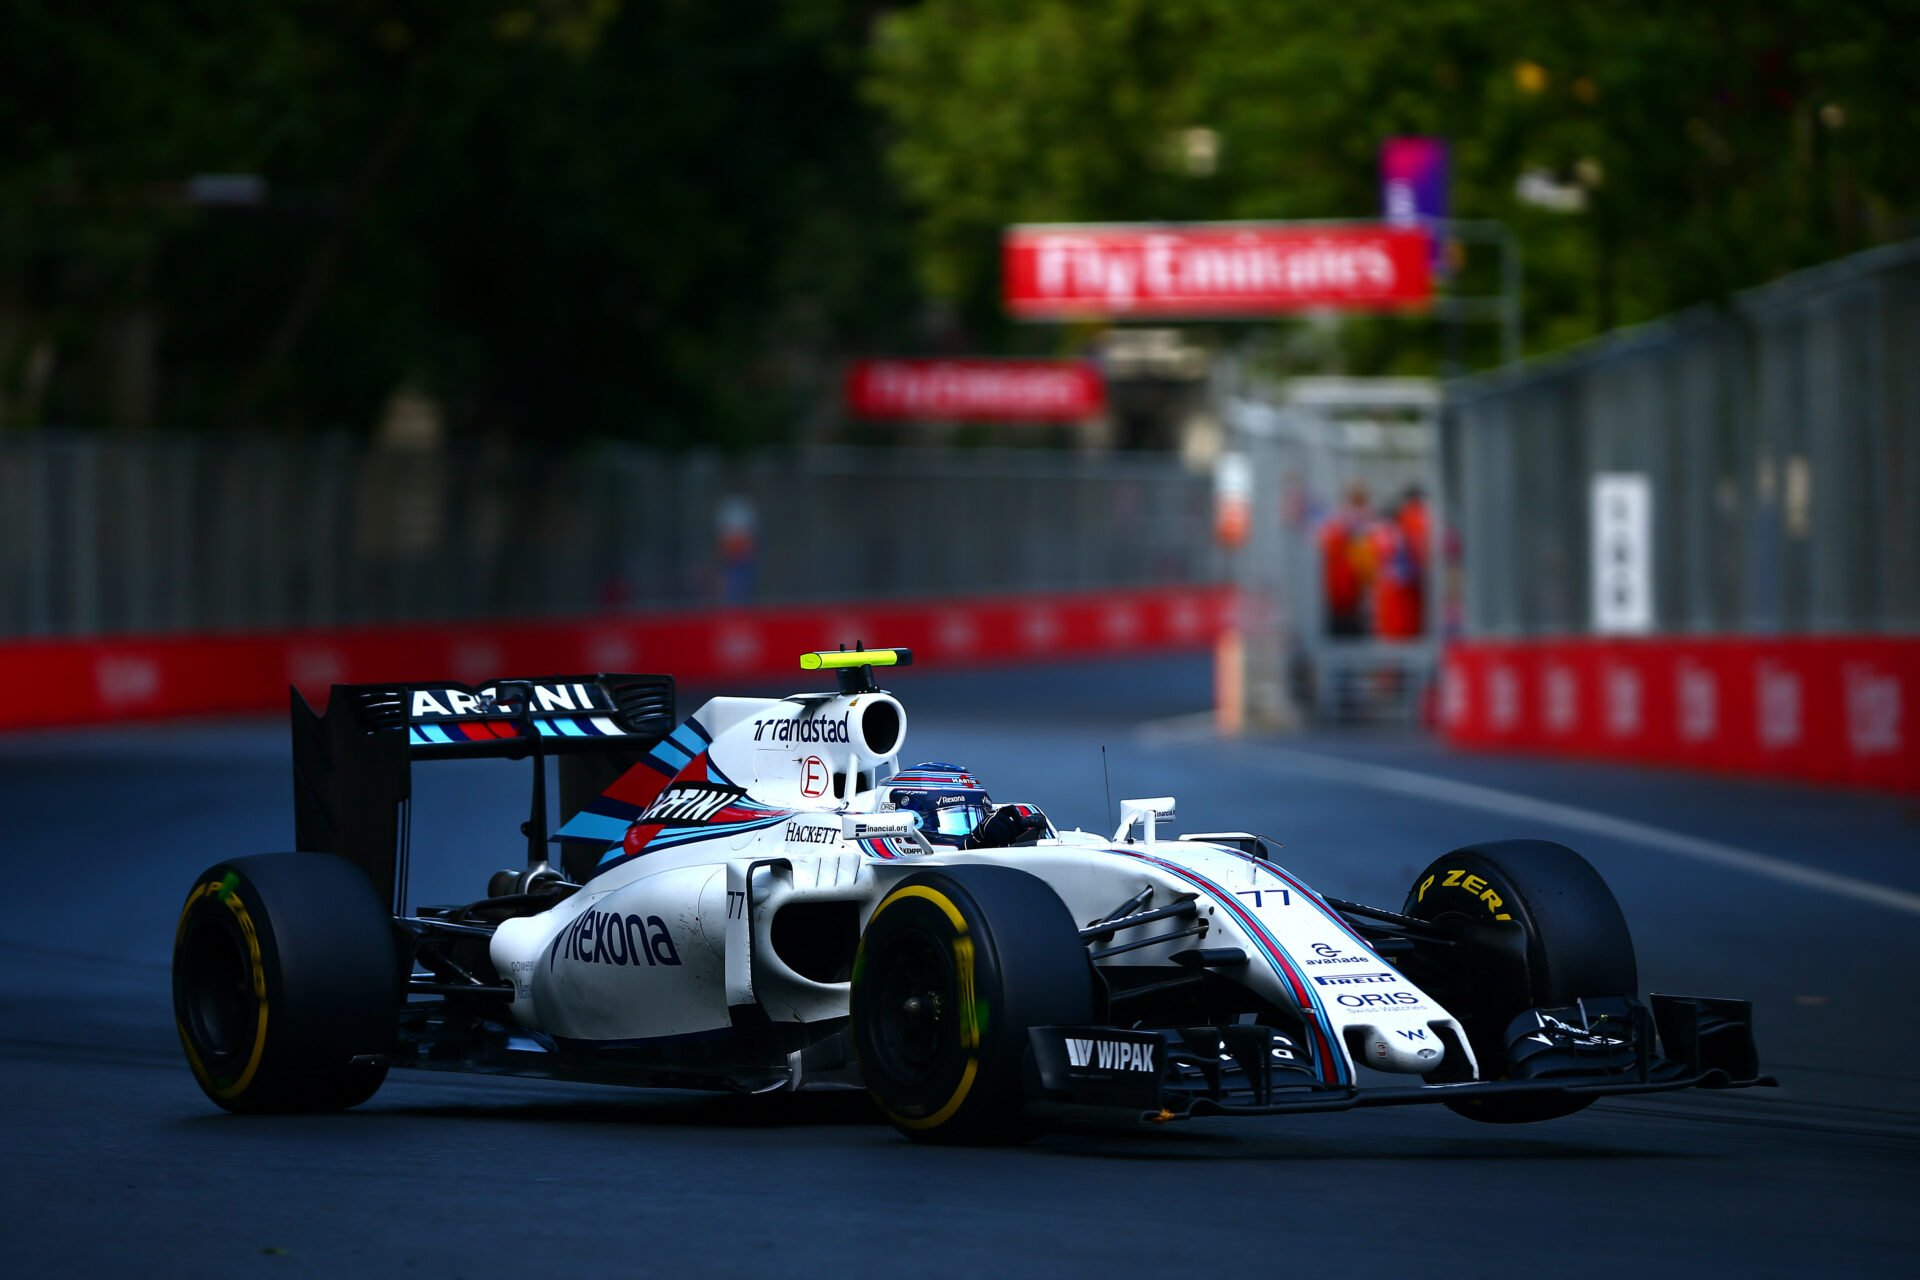
However, “how fast an F1 car goes” depends entirely on what you’re measuring and where. Straight-line speed on Baku’s 2.2 km main straight is a completely different number from average lap speed at Monza, which is again different from top speed through the Monaco tunnel. The official Guinness World Record for fastest speed in an F1 Grand Prix is 372.6 km/h (231.5 mph), set by Juan Pablo Montoya at Monza 2005. Moreover, the highest speed trap figure ever recorded in an official F1 session is approximately 378 km/h (234.9 mph), measured on Valtteri Bottas’s Williams in Baku 2016 qualifying.
Furthermore, in 2025, Max Verstappen set the fastest qualifying lap in F1 history at Monza — 1:18.792 at an average of 264.681 km/h (164.46 mph) — and also produced the fastest Grand Prix race average in history at 250.706 km/h (155.79 mph) from lights to flag. This guide covers all of it: every record, the engineering that produces these numbers, the track-by-track data, and how F1’s speed compares to every other racing series on earth.
F1 Speed Records — Every Benchmark That Matters
There are several distinct “speed records” in Formula 1. Consequently, the answer to “how fast do F1 cars go?” depends entirely on which metric you use. Race-day speed is fundamentally different from qualifying trap speed, which is again different from average lap speed. Each tells a different part of the story.
| Record Type | Figure (km/h) | Figure (mph) | Who / When | Source |
|---|---|---|---|---|
| 🏆 Fastest Official Race Speed | 372.6 km/h | 231.5 mph | JPMontoya · Monza 2005 Italian GP | Guinness World Records |
| Highest Speed Trap (Any Session) | ~378 km/h | ~234.9 mph | V. Bottas · Baku 2016 Qualifying | Williams / RacingNews365 |
| Fastest Qualifying Lap (Average Speed) | 264.681 km/h | 164.46 mph | M. Verstappen · Monza 2025 | FIA Classification / F1.com |
| Fastest Race Average Speed | 250.706 km/h | 155.79 mph | M. Verstappen · Monza 2025 | FIA (prev. Schumacher 2003) |
| F1-Derived Car (Test / Non-Race) | 397.36 km/h | 246.9 mph | Honda RA106 · Bonneville 2006 | Honda Motor Co. |
| Indy 500 Pole (4-lap avg, ref.) | 376.94 km/h | 234.220 mph | S. McLaughlin · IMS 2024 | Official IMS Statistics |
| MotoGP Top Speed Record (ref.) | 366.1 km/h | 227.4 mph | B. Binder · Mugello 2023/24 | Official MotoGP Series |
Why There Are Two Different “Records” — Race vs Qualifying
This is the central confusion for most fans, and it’s worth unpacking properly. The Montoya Guinness record (372.6 km/h) is genuinely the fastest speed achieved during an actual Formula 1 race. The car carried race fuel, ran in race-setup trim and had no special assistance beyond the slipstream available to any race competitor.
The Bottas Baku number (~378 km/h) is categorically different. In qualifying, cars run with minimum fuel and maximum power modes. Furthermore, Bottas had a significant tow — he was following another car that punched a hole in the air, reducing drag at the critical final acceleration point. Additionally, the Baku speed trap is positioned before the car’s actual braking point on the 2.2 km straight, meaning the car continued accelerating past the trap. Consequently, these figures aren’t directly comparable.
When Verstappen set a 1:18.792 qualifying lap at Monza in 2025 at an average of 264.681 km/h (164.46 mph), he didn’t just set a fastest lap record. He redefined what was thought possible at the Temple of Speed — a circuit that was already running the fastest lap averages in history. Moreover, his race-average of 250.706 km/h lights to flag eclipsed Michael Schumacher’s 2003 record by a meaningful margin. This is the true measure of how fast F1 cars have become: not a peak trap reading, but sustained speed across an entire lap.
Why Are F1 Cars So Fast? The Four Forces Explained
A 1,000 horsepower hypercar would be comprehensively beaten by an F1 car on any racing circuit. The raw power number isn’t the reason. Rather, the speed comes from a violent, perfectly calibrated interaction of four distinct engineering systems — each one dependent on the others to function at the level F1 requires.
At 300 km/h, an F1 car is generating so much downforce that it would theoretically drive upside down on a ceiling — but the engine oil would drain and it would fail immediately. The physics work. The practicality doesn’t.
For further context on the physical extremes F1 drivers face, see our guide on G-force in F1 vs a fighter jet — the comparison is more surprising than most people expect.
F1 Car Acceleration — 0–60, 0–124 & 0–186 mph Explained
The 0–60 mph figure for an F1 car is approximately 2.6 seconds. That sounds impressive. However, a Tesla Model S Plaid is quicker from 0–60. So is an Ariel Atom. The reason is fundamental physics: an F1 car is a 1,000 hp rear-wheel-drive machine with no launch control and no traction control. Therefore, getting off the line without incinerating the rear tyres in a cloud of smoke is a fine art of clutch management and throttle sensitivity.
The real story starts at 100 km/h. From that point onward, as aerodynamic downforce builds and compresses the tyres harder into the surface, the acceleration becomes relentless in a way no road car can replicate. A hypercar’s power-to-drag ratio deteriorates sharply above 200 km/h. An F1 car’s effective acceleration almost improves, because more speed means more downforce, which means more mechanical grip, which means more throttle can be applied.
| Benchmark | Time | Notes |
|---|---|---|
| 0 – 100 km/h (0–62 mph) | ~2.6 sec | Traction-limited · No launch/traction control |
| 0 – 200 km/h (0–124 mph) | ~4.8 sec | Where F1 separates from everything else |
| 0 – 300 km/h (0–186 mph) | ~10.5 sec | Full aero load engaged · Pull is relentless |
| 300 km/h to standstill | ~2.1 sec | 6G deceleration · Carbon brakes at 1,000°C |
| 200 km/h to 50 km/h | ~1.5 sec | Equivalent to hitting a wall at 60 mph (driver’s body) |
Getting to 200 km/h (124 mph) in 4.8 seconds is where F1’s true performance advantage over everything else becomes clear. A $3M Bugatti Chiron Super Sport does 0–200 km/h in approximately 6.1 seconds. A Rimac Nevera — the world’s fastest production electric car — manages around 4.3 seconds. Furthermore, those road cars have launch control, all-wheel drive and perfectly optimised traction systems. The F1 car achieves comparable times on rear wheels only, with no electronic traction assistance, while also generating enough heat from the rear tyres to warp the air around them. The 100–300 km/h range is where an F1 car leaves every road vehicle for dead.
How Fast Do F1 Cars Go on Each Circuit?
The single biggest misconception about F1 speed is treating it as a fixed number. In reality, top speed varies by 80–100 km/h depending on the circuit. A car at Monaco barely exceeds 290 km/h (180 mph) through the tunnel. That same car at Monza five months later touches 370+ km/h on the same engine. The difference is entirely aerodynamic configuration.
Top Speed by Circuit — Visual Comparison
Why Monaco and Monza Are at Opposite Extremes
Monaco runs the biggest wings on the calendar. Every car is configured for maximum downforce, because the circuit demands it: 19 corners in 3.337 km, walls centimetres from the bodywork, zero runoff. As a result, the car corners brilliantly — but the enormous wing creates massive drag, capping straight-line speed around 290 km/h through the tunnel.
Monza is the exact opposite. Teams arrive in Lombardy with the smallest, flattest wing packages they run all year. Therefore, every gram of aerodynamic drag is stripped away to let the engine breathe. The car becomes unstable in the three chicanes but reaches speeds beyond 370 km/h between them. Consequently, the average lap speed — 264 km/h in qualifying, 250 km/h in the race — is the highest of any circuit on the calendar.
Mexico City sits at 2,285 metres (7,497 feet) above sea level. The air is approximately 22% less dense than at sea level. This means less aerodynamic drag — good for top speed — but simultaneously less downforce and significantly less engine cooling. As a result, engines run hotter, brakes take longer to heat into their operating window, and tyre pressures behave differently. Mexico routinely produces the highest speed trap readings of any venue where low-wing setups are employed, because the thin air lets cars reach terminal velocity earlier in the straight. The trade-off is that cornering speed suffers dramatically from the reduced aerodynamic load.
DRS, Downforce & the Drag-Speed Trade-Off
The Drag Reduction System — DRS — is the most straightforward of F1’s speed tools. When a driver is within one second of the car ahead at a designated detection point, a flap on the rear wing can be opened by pressing a button on the steering wheel. The open flap “stalls” the rear wing — reducing downforce by reducing the wing’s angle of attack — which drops aerodynamic drag and adds approximately 10–15 km/h (6–9 mph) of straight-line speed.
However, DRS is only part of the downforce story. The fundamental challenge every F1 team faces every race weekend is this: downforce equals cornering speed but also equals drag. More drag equals lower top speed on straights. Therefore, the setup decision for each circuit is not just about adding grip — it’s about finding the precise balance where the time gained in corners is not lost on straights.
The High Downforce vs Low Drag Decision
| Setup | Wing Angle | Downforce | Drag | Top Speed | Best For |
|---|---|---|---|---|---|
| Maximum Downforce | Large / tall wings | Very high | Very high | ~290 km/h | Monaco · slow streets |
| Balanced (Medium) | Medium wings | Moderate | Moderate | ~315–330 km/h | Silverstone · Barcelona |
| Low Downforce | Flat / minimal wings | Low | Very low | ~370+ km/h | Monza · Baku straights |
Additionally, slipstreaming — drafting in the aerodynamic wake of the car ahead — reduces drag on the following car, boosting top speed by a similar margin to DRS. At Monza, where slipstream effects are greatest due to the long straights and low-drag setups, the combination of DRS and a natural tow can add up to 25–30 km/h over a car running without both advantages. This is precisely why Baku qualifying — where a driver could have DRS active, a natural tow, maximum engine power mode and the longest straight in F1 — produced Bottas’s ~378 km/h trap figure.
For a deeper technical breakdown, our guides on clean air in F1 and how the diffuser works cover both sides of the downforce equation.
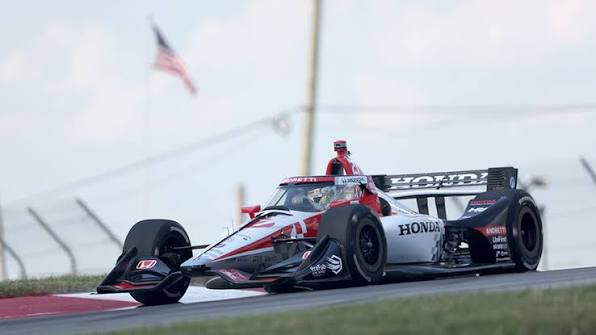
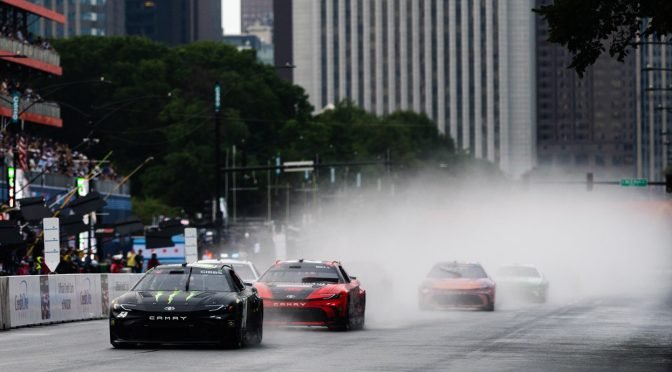
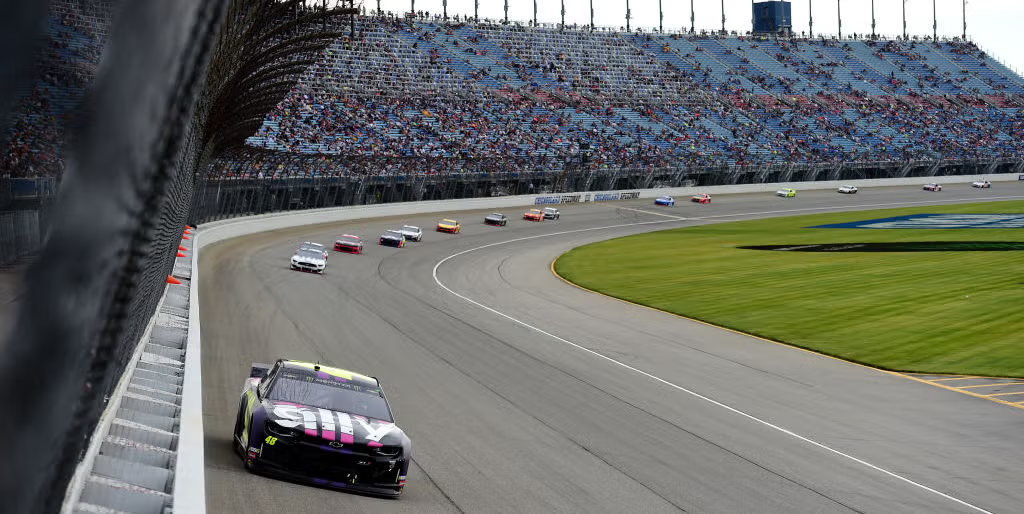
F1 vs IndyCar, NASCAR & MotoGP — Speed Comparison
The question of whether F1 is “the fastest” depends on the metric. On a road circuit, F1 is unambiguously the fastest by a large margin. However, on an oval straight, an IndyCar will outrun it. Moreover, MotoGP machines — on two wheels with a fraction of the aerodynamic cross-section — produce remarkably similar top speeds at specific circuits.
An IndyCar at Indianapolis regularly averages 376 km/h over four qualifying laps — faster than any official F1 race speed. However, IndyCar achieves this on a flat oval with almost no wings, running at near-constant throttle. The comparison at Circuit of the Americas in 2019 illustrates the real picture: F1 qualifying averaged 206.374 km/h lap speed vs IndyCar’s 186.349 km/h on the same circuit. F1 cars are dramatically faster through corners, under braking, and around a full lap. They simply don’t need to sustain 376 km/h because their layout never gives them a straight long enough to reach it. Full IndyCar vs F1 technical comparison here.
| Series | Peak Top Speed | Road Circuit Lap Speed | Track Types | Key Advantage |
|---|---|---|---|---|
| Formula 1 | ~378 km/h trap | 264 km/h avg (Monza) | Road & street only | Cornering · braking · lap time |
| IndyCar | ~376 km/h (oval 4-lap) | ~186 km/h avg (COTA) | Oval · road · street | Sustained oval top speed |
| MotoGP | ~366 km/h (Mugello) | ~180 km/h avg | Road circuits | Power-to-weight on straights |
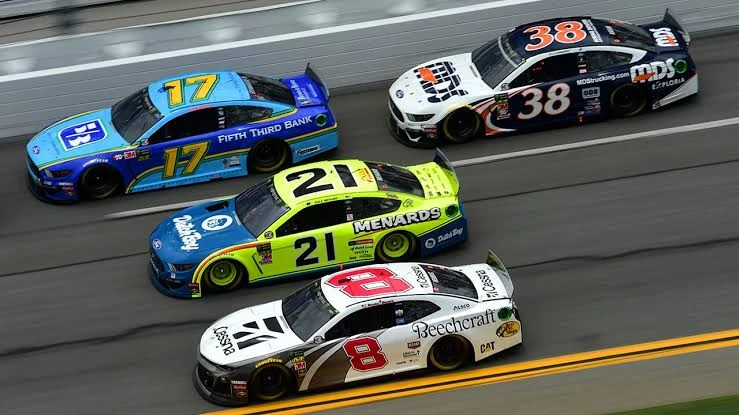
| NASCAR Cup | ~322 km/h (Daytona) | ~170–180 km/h avg | Mainly ovals | Pack drafting at superspeedways |
| NHRA Top Fuel | ~530 km/h (1/4 mile) | N/A (drag racing only) | Straight drag strip only | Absolute straight-line acceleration |
For context on other series, our guides on NASCAR top speeds, Formula E performance and NHRA drag racing figures cover each series in detail.
How Fast Do F1 Cars Go — Frequently Asked Questions
The Speed That Defines Formula 1
The numbers that define Formula 1 speed — 372.6 km/h in a race, 378 km/h in qualifying, 264 km/h average lap at Monza — are extraordinary by any measure. However, they don’t capture what makes an F1 car truly fast. The lap average at Monza is more meaningful than the Baku straight-line trap, because it measures sustained speed through braking zones, corners and acceleration phases simultaneously.
Moreover, what separates an F1 car from everything else isn’t top speed — it’s the combination of top speed, cornering speed and braking performance applied continuously over 55 laps without mechanical failure. Therefore, the question isn’t just how fast F1 cars go. It’s how they can go that fast consistently, reliably, lap after lap, weekend after weekend, while a human being sits in the cockpit absorbing 5G cornering loads and 6G braking forces without losing the mental acuity to manage 60 dials, 50 buttons and a race engineer talking through the radio.
That’s the engineering achievement. Speed is simply its most visible expression.