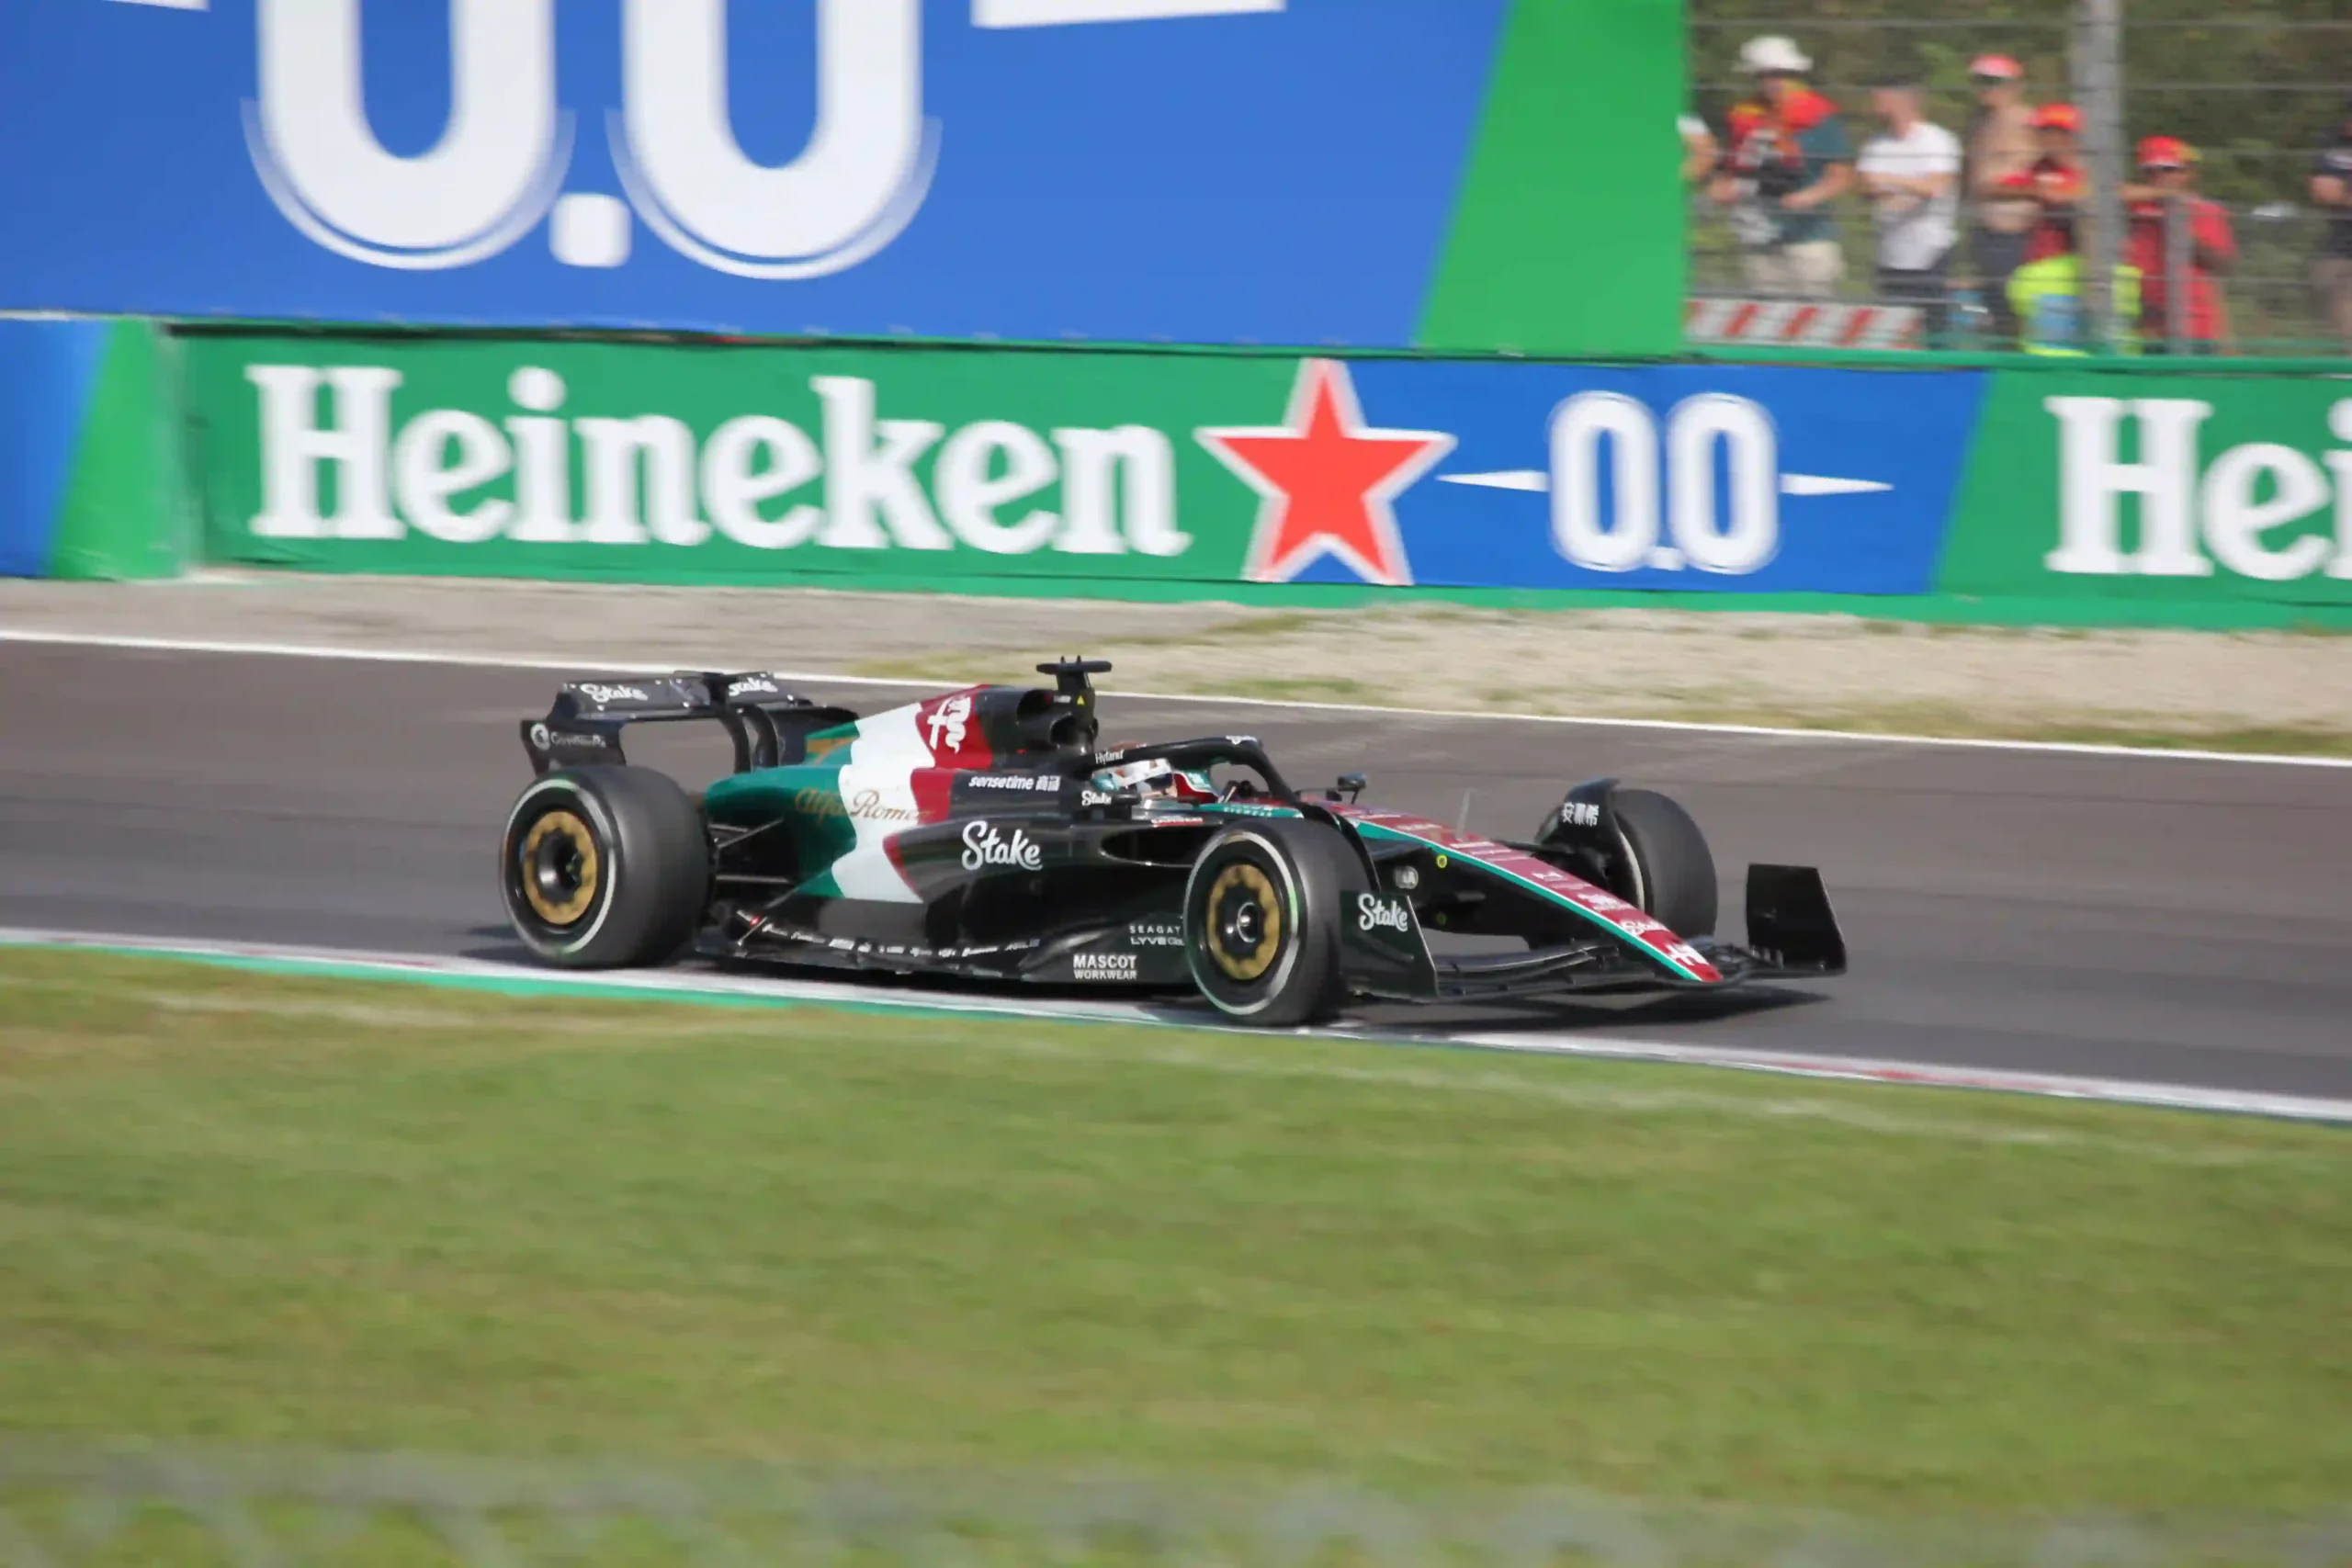
Fastest F1 Tracks Ranked
Monza still owns Formula 1’s greatest sustained speed record, but Jeddah, Albert Park, Silverstone and Spa create very different versions of a fast lap.
Monza ranks first, followed by Jeddah, Albert Park, Silverstone and Spa-Francorchamps. The order uses representative peak qualifying averages on current layouts rather than isolated speed-trap readings.
A Formula 1 circuit can create a huge top speed without producing a fast average lap.
Baku proves the point. Its waterfront straight has produced one of the highest reported speeds in Formula 1 history.
However, the narrow castle section and repeated 90-degree corners reduce its full-lap average. Therefore, Baku does not lead this ranking.
Monza is different. Its long straights, fast Curva Grande and low-downforce setup keep the car moving quickly across nearly the entire lap.
Lewis Hamilton’s 2020 pole lap averaged 264.362 km/h. Formula 1 recognizes it as the fastest qualifying lap by average speed.
The 2025 Italian Grand Prix added another record. Max Verstappen won at an average of 250.706 km/h, the fastest World Championship Grand Prix average.
Jeddah ranks second. Hamilton’s 2021 pole lap averaged almost 254 km/h across 27 corners and street-circuit walls.
Albert Park follows after its faster 2022 redesign. The removed chicane and four flowing DRS-era sections raised its qualifying average dramatically.
Silverstone ranks fourth. It creates speed through corners rather than only on straights.
Spa completes the top five. Its long lap balances high-speed sections with a technical middle sector and heavy elevation.
This fastest F1 tracks ranked list uses representative dry qualifying benchmarks on current layouts.
The numbers are calculated from official circuit length and lap time. They are not a 2026-only performance table.
That distinction matters because Formula 1 changed its cars for 2026. Active Aero, Straight Mode and new power-unit energy rules altered speed profiles.
Moreover, several 2026 races had not happened when this article was updated. Using established benchmark laps creates a fairer comparison.
The ranking also separates average speed from peak speed. A speed trap measures one small point, while average speed covers every meter.
Consequently, Baku, Mexico City and Las Vegas receive detailed analysis even when their overall lap averages differ.
How We Ranked the Fastest Formula 1 Circuits
This ranking divides circuit length by a representative dry qualifying lap on the current layout. The result is average speed across the complete lap, including braking and slow corners.
Average speed is the clearest way to compare complete circuits.
It rewards long straights, but it also rewards corners that need little braking. Therefore, it reflects the whole layout.
Why We Did Not Rank by Speed Trap Alone
A speed trap measures the car at one point.
Wind, slipstream and electrical deployment can change that reading. Moreover, the fastest driver at the trap may have a slow overall lap.
Why Qualifying Creates the Cleanest Benchmark
Qualifying cars carry little fuel and use their softest suitable tires.
Drivers also deploy energy aggressively. Consequently, qualifying provides a strong view of a circuit’s peak lap potential.
Why the Benchmarks Come From Different Years
Weather and regulations change every season.
Some 2026 events remained in the future on July 24. Therefore, the ranking uses established dry benchmarks from the current layout.
Why This Is Not an Official FIA Ranking
Formula 1 and the FIA do not publish one universal fastest-track table.
The order is World of Speed analysis using official lengths and lap times. Rounded averages may differ slightly from broadcast graphics.
Average speed tells us how quickly a circuit flows. Top speed tells us how extreme one straight becomes. A complete speed guide needs both measurements.
Fastest F1 Tracks Ranked: Complete Top 12
| Rank | Circuit | Representative Benchmark | Calculated Average | Speed Character |
|---|---|---|---|---|
| 1 | Monza | 1:18.887, 2020 | 264.362 km/h | Low downforce, long straights |
| 2 | Jeddah | 1:27.511, 2021 | 253.984 km/h | Fastest street circuit |
| 3 | Albert Park | 1:15.096, 2025 | Approx. 253.0 km/h | Fast parkland flow |
| 4 | Silverstone | 1:24.303, 2020 | 251.564 km/h | High-speed cornering |
| 5 | Spa-Francorchamps | 1:41.252, 2020 | 249.026 km/h | Straights, elevation, fast sector |
| 6 | Red Bull Ring | 1:02.939, 2020 | 246.982 km/h | Short lap, full-throttle climbs |
| 7 | Lusail | 1:20.827, 2021 | 241.360 km/h | Sustained medium-high speed |
| 8 | Las Vegas | 1:32.726, 2023 | 240.748 km/h | Long straights, slow corners |
| 9 | Suzuka | 1:27.064, 2019 | 240.113 km/h | Fast connected sequences |
| 10 | Interlagos | 1:07.281, 2018 | 230.561 km/h | Short lap and uphill straight |
| 11 | Montreal | 1:10.240, 2019 | 223.514 km/h | Stop-start power circuit |
| 12 | Zandvoort | 1:08.885, 2021 | 222.580 km/h | Banked and flowing |
Reading the table: The averages are comparative benchmarks, not claims that every current car will reproduce those times. Weather, tires, regulations and surface changes affect each season.
1. Monza — Formula 1’s Fastest Circuit
Monza is the fastest Formula 1 circuit by sustained average speed. Lewis Hamilton’s 1:18.887 pole lap in 2020 averaged 264.362 km/h.
Monza earns first place without needing a complicated argument.
The 5.793-kilometer circuit contains only 11 corners. Drivers spend about 80 percent of the lap at full throttle.
Teams Use Their Smallest Rear Wings
Monza demands the lowest-downforce package of the season.
The rear wing becomes shallow and compact. Consequently, drag falls and acceleration continues deeper into each straight.
The Straights Occupy Most of the Lap
The pit straight leads into the heavy Rettifilo braking zone.
Drivers then accelerate through Curva Grande before another chicane. The run from Lesmo 2 to Ascari also remains extremely fast.
Curva Grande Protects Average Speed
A track can have long straights and still lose average speed through hairpins.
Curva Grande is different. Modern Formula 1 cars take the sweeping right at very high speed.
Ascari Rewards Stability Without Killing Momentum
The three-part chicane is much faster than Rettifilo.
A clean line keeps the car moving toward Parabolica. However, curb strikes can unsettle a low-downforce car.
Parabolica Starts the Next Speed Run
The final corner demands patience on entry.
Drivers then accelerate early and carry that speed across the line. Therefore, its exit affects two timed laps in qualifying.
The 2025 Race Added a New Record
Max Verstappen won the 2025 Italian Grand Prix at an average of 250.706 km/h.
Formula 1 reported it as the fastest World Championship Grand Prix average. That result reinforced Monza’s Temple of Speed identity.
Why Top Speed Is Not Always Highest at Monza
Monza produces the fastest average, but Baku and Mexico have recorded higher single-point speeds.
Slipstream, altitude and extra straight length explain the difference. Monza remains faster across the full lap.
The highest verified qualifying average in Formula 1 history.
The season’s smallest rear-wing package and lowest drag.
Approximately four-fifths of the lap.
Braking stability, traction and aerodynamic efficiency.
Read our guides to downforce, wing angle and slipstreaming.
2. Jeddah — The Fastest Street Circuit
Jeddah is Formula 1’s fastest street circuit. Hamilton’s 2021 pole lap averaged about 253.984 km/h around the 6.174-kilometer, 27-corner layout.
Jeddah combines street-circuit barriers with permanent-circuit flow.
That mixture creates a speed profile unlike Monaco, Singapore or Baku.
Many Corners Require Little Braking
The circuit has 27 numbered turns, the most on the calendar.
However, many are shallow bends. Drivers keep the throttle open while changing direction beside walls.
The Average Is More Important Than the Peak
Official Formula 1 material describes Jeddah averages near 250 km/h.
That places it second only to Monza. Moreover, the speed continues through blind sections rather than one isolated straight.
Turn 13 Preserves Momentum
The banked left-hander looks like a corner that should reduce average speed.
Instead, banking supports the car. Drivers carry significant speed before accelerating toward another flowing section.
The Walls Increase Perceived Speed
A 250 km/h corner feels different when open runoff surrounds the car.
At Jeddah, fencing and concrete move rapidly through peripheral vision. Therefore, the lap appears even faster from the cockpit.
Wind Can Change the Balance
The Red Sea location exposes the circuit to coastal wind.
A headwind can add downforce and drag. Meanwhile, a tailwind reduces front grip and extends braking distances.
Qualifying Traffic Creates Extreme Closing Speeds
Drivers preparing a lap travel much slower than cars already pushing.
Blind bends reduce warning time. Consequently, engineer communication becomes part of the speed challenge.
Why Jeddah Ranks Above Albert Park
The two benchmarks are close.
However, Jeddah sustains its speed through more corners and beside barriers. It remains Formula 1’s official fastest street circuit.
3. Albert Park — The Fastest Parkland Circuit
The 2022 redesign removed a slow chicane, widened several corners and created a faster 5.278-kilometer layout. Representative qualifying laps now average roughly 253 km/h.
Albert Park once felt like a stop-start temporary circuit.
The 2022 changes transformed its rhythm and average speed.
The Old Turn 9-10 Chicane Disappeared
The previous layout required a significant slowdown.
Removing it created a long acceleration section beside the lake. Therefore, the lap gained both speed and passing potential.
Several Corners Became Wider
More track width allows a straighter and faster line.
Drivers carry momentum rather than waiting for rotation. This raises average speed even when peak speed changes little.
The Surface Still Behaves Like a Temporary Venue
Public park roads offer less permanent rubber than a dedicated circuit.
Grip evolves quickly across the weekend. Drivers must increase commitment as the track improves.
Fast Direction Changes Control the Lap
Turns 9 and 10 on the revised layout demand confidence.
A small lift or steering correction costs speed into the following straight. Aerodynamic stability matters more than raw power there.
Braking Zones Remain Important
Albert Park is not flat out everywhere.
Turn 1, Turn 3 and Turn 11 still require major speed reduction. A stable car can brake later without damaging the tires.
Why Albert Park Ranks Third
Its representative average now edges Silverstone’s famous benchmark.
However, Silverstone produces a greater proportion of speed through demanding corners. Albert Park combines open straights with fast parkland flow.
4. Silverstone — Speed Created Through Corners
Silverstone is one of the strongest answers because Copse, Maggots, Becketts, Chapel and Stowe preserve high speed while repeatedly loading the car.
Silverstone’s 251.564 km/h benchmark comes from Hamilton’s 2020 pole.
Unlike Monza, the lap creates much of that average while the steering wheel remains turned.
Abbey Begins the Lap at High Speed
The first corner is a fast right-hander.
Drivers attack immediately rather than building through a slow opening sector. That protects average speed from the timing line.
Copse Rewards Aerodynamic Confidence
The corner has become close to flat in strong cars.
However, wind and tire condition can change the limit. A small lift reduces speed before Maggots.
Maggots and Becketts Are a Speed Sequence
Drivers change direction several times under heavy lateral load.
The car must respond quickly without sliding. Consequently, downforce efficiency creates more lap time than simple horsepower.
Chapel Controls the Hangar Straight
A clean final direction change allows early throttle.
The car then accelerates for a long period. Therefore, one small correction costs time twice.
Stowe Adds a Fast Braking Challenge
Drivers arrive with high speed but still carry momentum into the right-hander.
Braking stability and front grip work together. Running wide compromises Vale and Club.
Why Silverstone Ranks Below Albert Park
The calculated benchmark is slightly lower.
Nevertheless, many drivers would call Silverstone the greater high-speed driving challenge. Its average comes from loaded corners rather than layout simplification.
Our guides to G-force, grip and oversteer and understeer explain the forces.
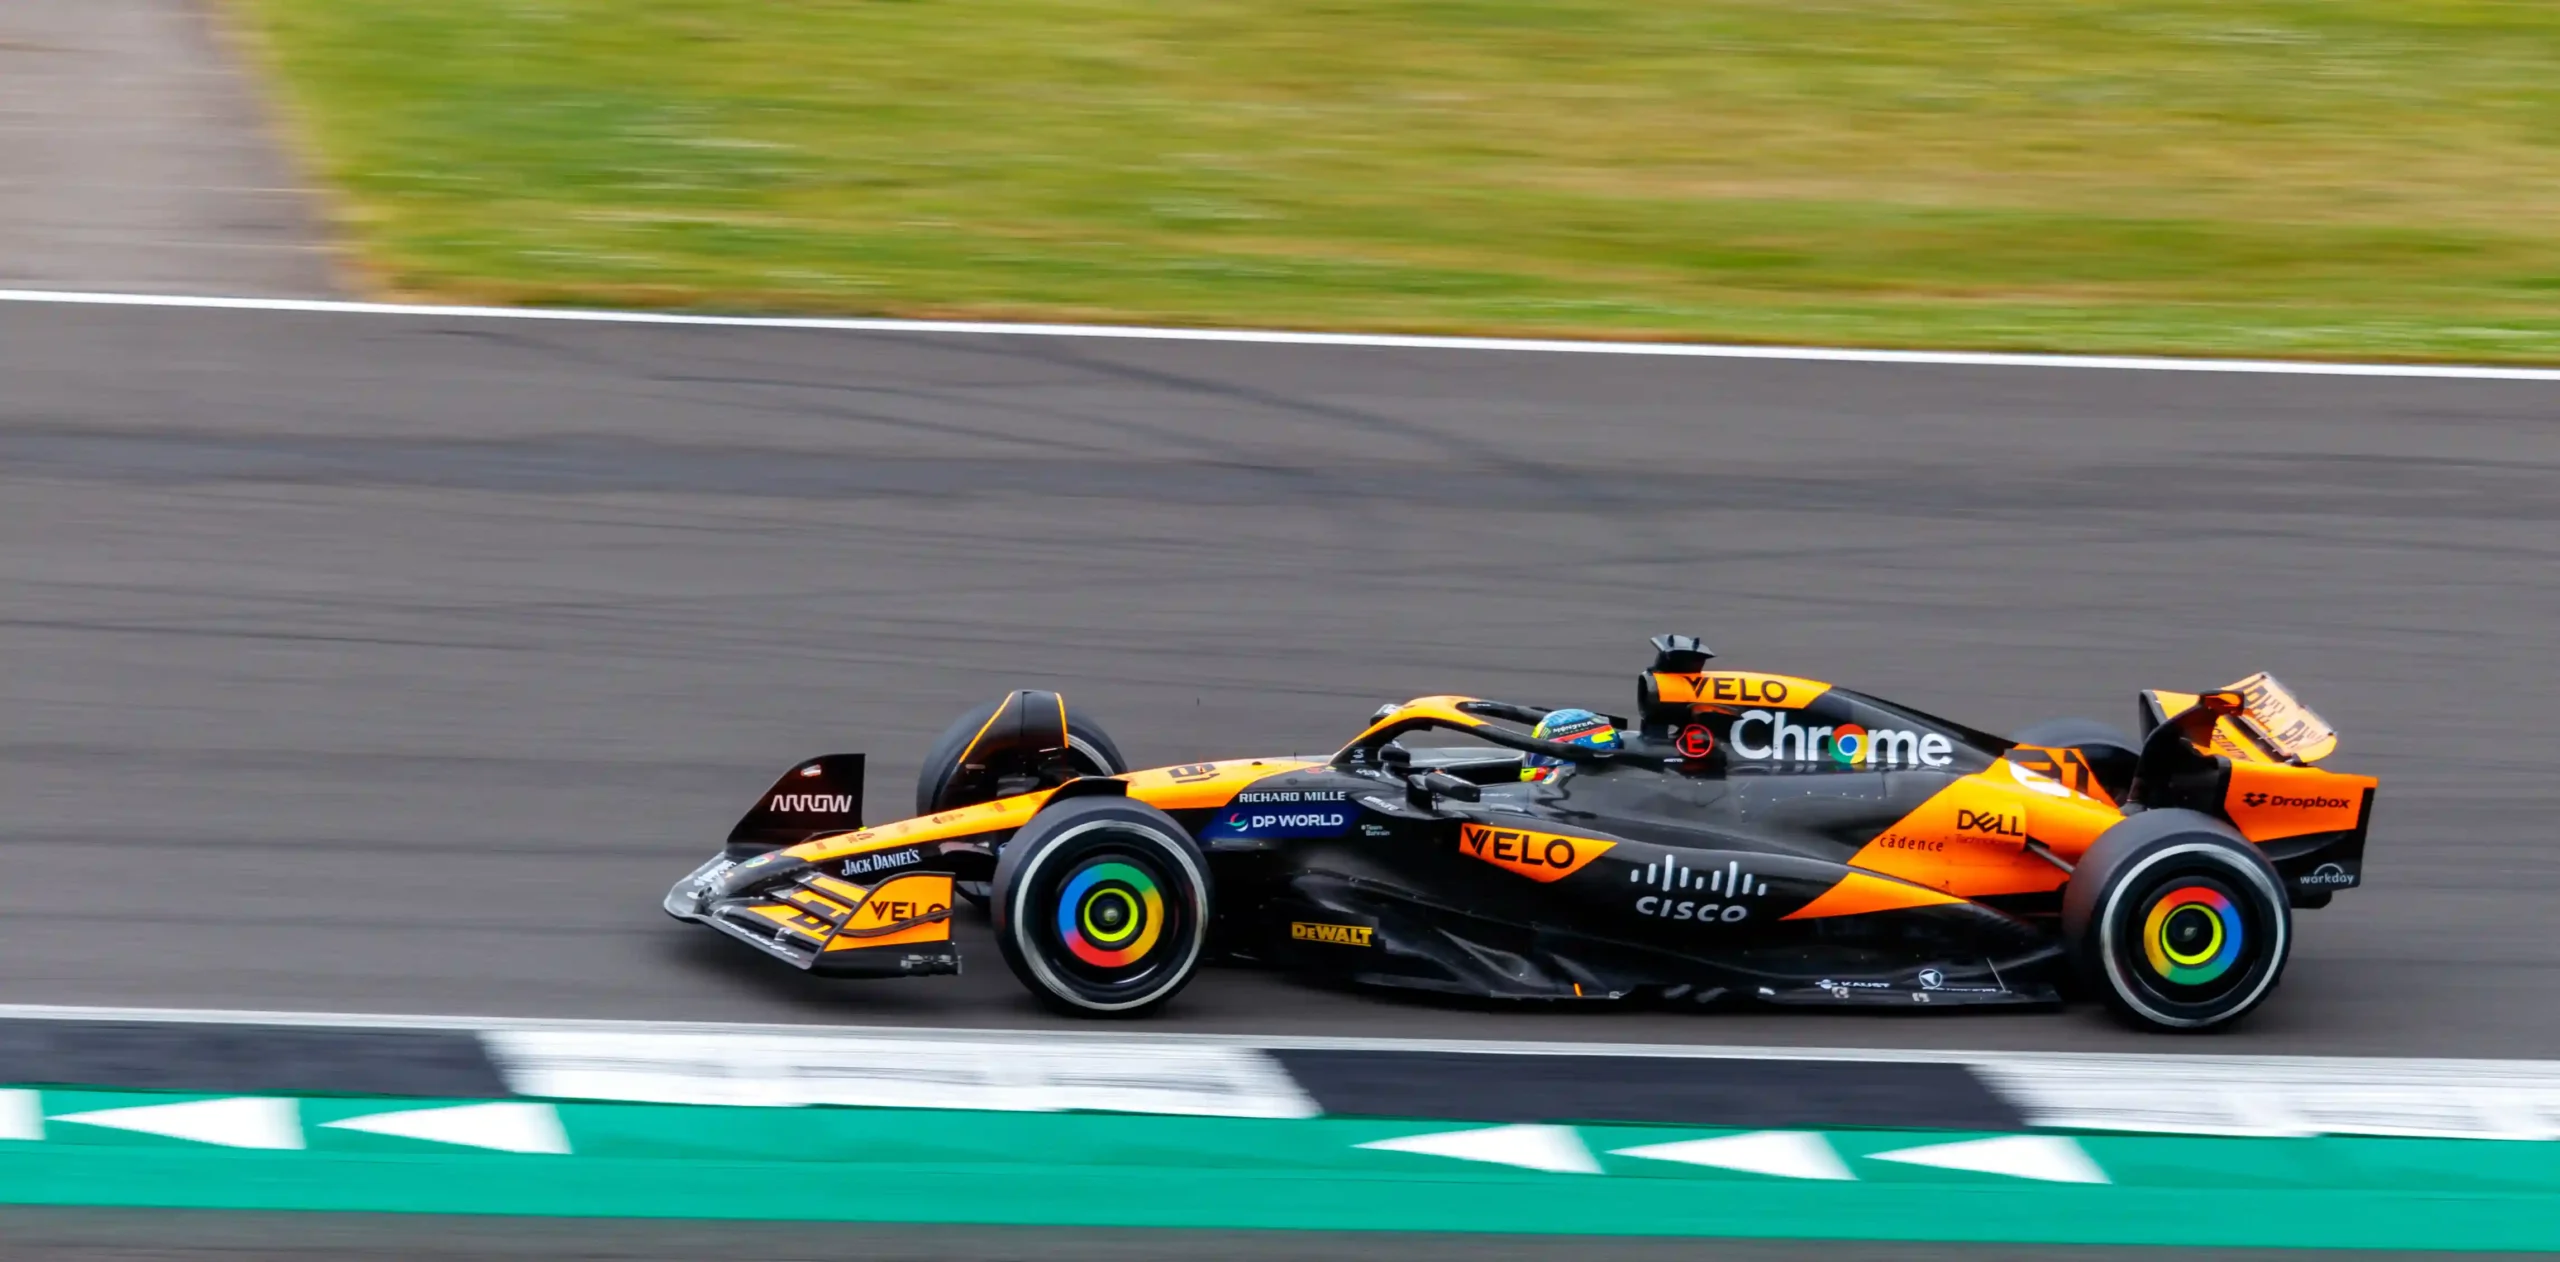
5. Spa-Francorchamps — Long-Lap Speed With Elevation
Silverstone’s representative qualifying average is slightly higher. Spa remains extremely fast, with a benchmark near 249 km/h across the calendar’s longest lap.
Spa measures 7.004 kilometers.
Its length magnifies every setup choice and weather change.
Eau Rouge and Raidillon Protect Momentum
Drivers accelerate downhill before climbing sharply.
Modern cars often remain near full throttle. The exit controls the entire Kemmel Straight.
The Kemmel Straight Rewards Low Drag
Teams need speed for attack and defense.
However, removing too much wing hurts the middle sector. Spa creates a genuine aerodynamic compromise.
Pouhon Creates Fast Average Speed
The double-left corner sustains significant lateral load.
A stable car carries speed without overheating the front tires. A slide costs time across both apexes.
Blanchimont Keeps the Final Sector Fast
The left-hander arrives after another long acceleration section.
Drivers need confidence despite wind and tire wear. The final chicane then produces a major braking event.
Weather Can Destroy a Speed Benchmark
One section may be dry while another receives rain.
Therefore, official lap times vary sharply between seasons. The 2020 dry benchmark shows the layout’s true potential.
Why Spa Ranks Fifth
Slow corners such as La Source and the final chicane reduce the average.
Nevertheless, very long fast sections keep Spa among Formula 1’s highest-speed circuits.
6. Red Bull Ring — The Fastest Short Lap
The Red Bull Ring has only 10 corners and several long full-throttle climbs. Its 4.318-kilometer lap produced a representative qualifying average near 247 km/h.
The Red Bull Ring is short, simple on paper and extremely quick.
Its 2020 pole benchmark lasted only 62.939 seconds.
The First Half Is Dominated by Acceleration
Turn 1 begins an uphill run.
Drivers then accelerate toward Turn 3, brake heavily and launch down another straight. Power and traction shape the sector.
Elevation Raises the Challenge
The circuit changes height by more than 60 meters.
Uphill sections reduce acceleration slightly, while downhill braking raises instability. The speed remains high despite the terrain.
The Final Sector Uses Fast Corners
Turns 6 through 10 flow downhill.
Drivers carry momentum and use the full width. Track-limit precision becomes crucial.
Few Corners Mean Small Gaps
Every small mistake represents a large percentage of lap time.
Consequently, qualifying fields compress tightly. A tenth can move a driver several positions.
Why Austria Ranks Sixth
The short lap has fewer sustained fast sequences than Silverstone or Spa.
However, its limited corner count and long acceleration phases create an exceptional average.
7. Lusail — Sustained Medium-High Speed
Lusail contains many connected medium- and high-speed corners. Hamilton’s 2021 pole benchmark averaged about 241.36 km/h.
Lusail was designed around motorcycle racing.
Its broad curves allow Formula 1 cars to maintain aerodynamic load for long periods.
Most Corners Reward Momentum
The layout contains fewer stop-start sections than Montreal or Baku.
Therefore, the car spends more time in a useful aerodynamic window.
The Main Straight Adds Peak Speed
The pit straight extends for more than one kilometer.
A clean final-corner exit creates a strong speed-trap figure before Turn 1.
Tire Load Limits the Driver
High average speed places energy into the tire carcass.
Drivers must avoid sliding. Consequently, the fastest theoretical line may not protect the race stint.
Night Conditions Help Consistency
Floodlights provide stable visibility.
However, track temperature can remain warm. Teams balance cooling with aerodynamic efficiency.
Why Lusail Ranks Seventh
Its qualifying average sits above Las Vegas and Suzuka.
Nevertheless, the circuit lacks the ultra-long low-drag sections of the top six.
8. Las Vegas — Long-Straight Street Speed
Yes. The 6.201-kilometer Strip circuit combines very long straights with low-downforce setups. Its representative dry qualifying average is about 240.75 km/h.
Las Vegas looks built for maximum speed.
The Strip section allows long full-throttle running through the center of the city.
The Car Uses a Monza-Like Wing Level
Teams bring shallow rear wings and efficient bodywork.
Formula 1’s original circuit data predicted average speeds similar to Monza. Actual slow corners reduce the completed-lap average.
Cold Temperatures Change Acceleration
The race runs late at night in November.
Cold air improves power and aerodynamic density. However, cold tires reduce traction and braking grip.
The Strip Creates a Long Speed Build
Cars accelerate for an extended period.
Straight Mode and electrical deployment now influence the 2026 speed profile. The braking zone then becomes a major overtaking point.
Slow Corners Reduce the Full-Lap Average
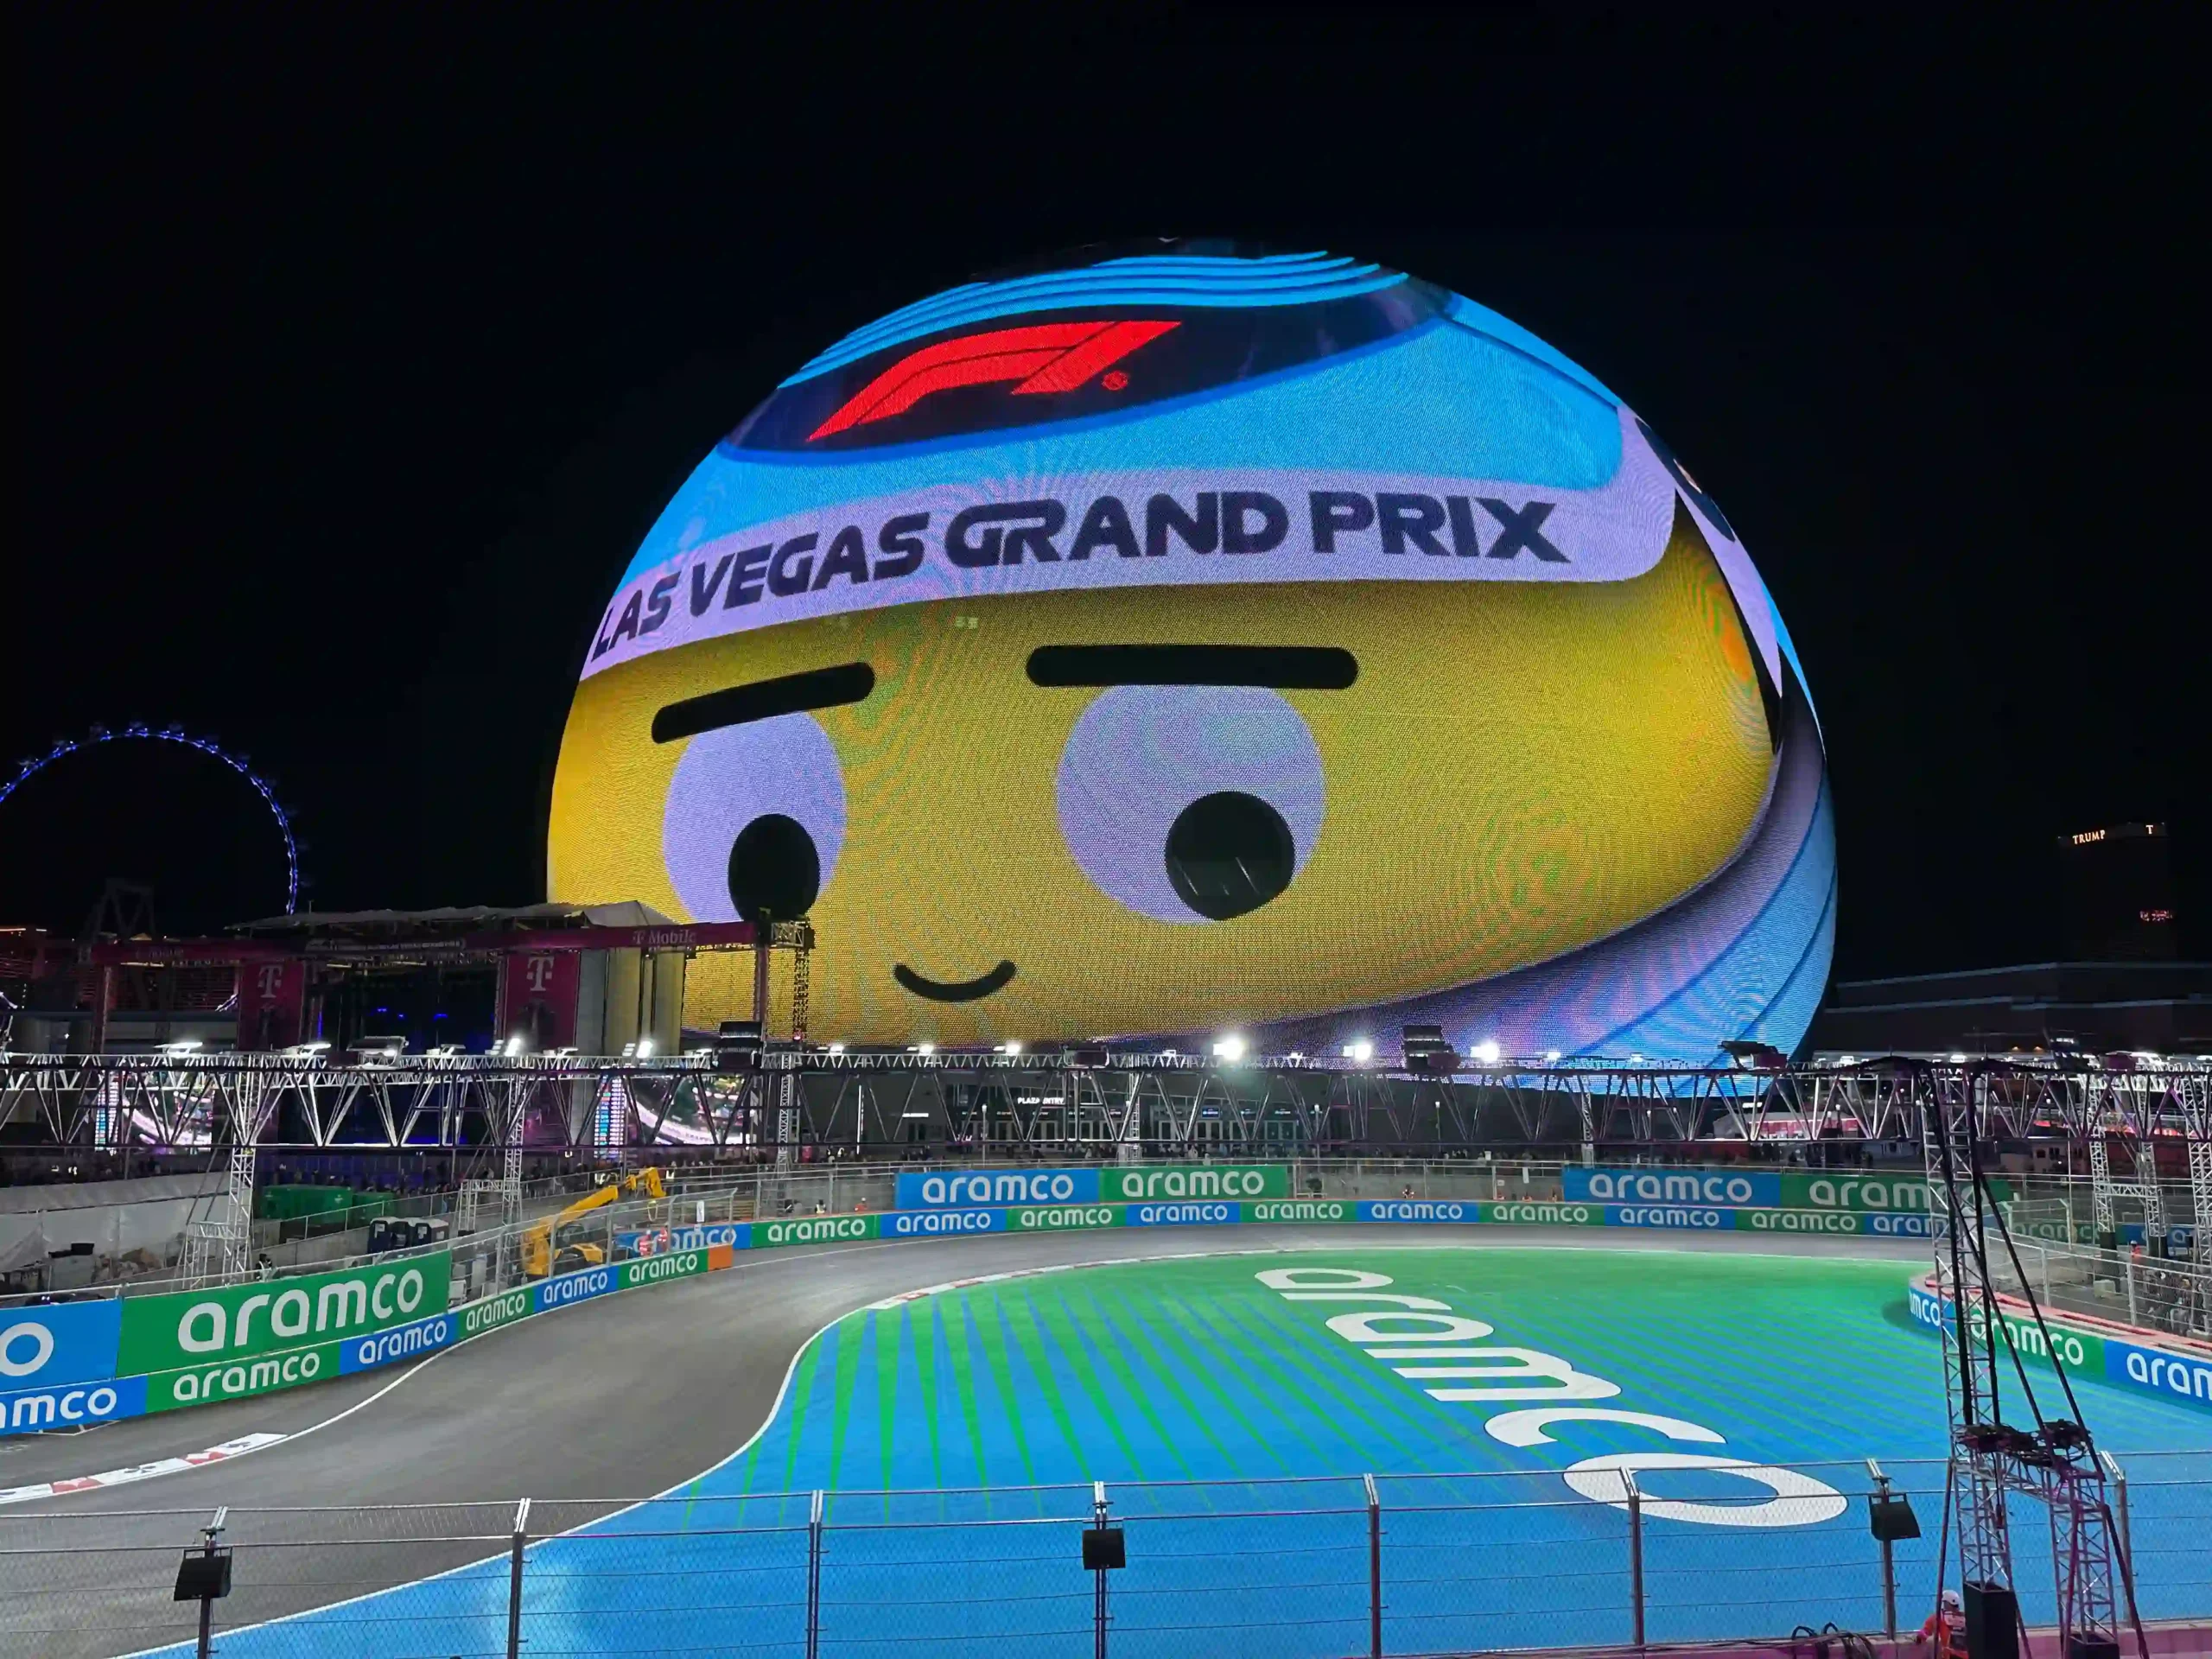
Turns near the Sphere and several 90-degree sections require major speed reduction.
Therefore, Las Vegas does not match Monza across the complete lap. Its peak straight-line performance remains enormous.
Low Grip Increases Wheelspin
Public roads begin the weekend with limited rubber.
A driver who spins the rear tires loses speed for the full straight. Mechanical grip matters as much as engine output.
Why Las Vegas Ranks Eighth
The long straights create spectacular top speeds.
However, the slow corner count pulls the average below Lusail. It remains one of the fastest street venues.
9. Suzuka — Fastest Through Connected Technical Corners
The benchmark averages are close. Las Vegas is faster on straights, while Suzuka preserves speed through the Esses, Dunlop, Spoon and 130R.
Suzuka’s representative average is about 240.11 km/h.
The figure is remarkable because the 5.807-kilometer lap contains 18 corners.
The Esses Create Flowing Speed
Drivers change direction repeatedly while climbing.
A good car remains balanced and loses little momentum. One correction damages several following turns.
Dunlop Sustains Load Uphill
The long left-hander continues after the Esses.
Drivers hold speed under lateral load. Front-tire temperature becomes a limiting factor.
Spoon Controls a Long Acceleration Zone
The double-apex corner requires patience.
A clean exit creates speed toward 130R. Therefore, mechanical traction supports the circuit’s high average.
130R Protects the Final Sector
Modern cars often take 130R flat in dry qualifying.
That means the car does not sacrifice much average speed before the chicane. Wind and tire condition still matter.
Why Suzuka Ranks Ninth
Its straights are shorter than Las Vegas or Monza.
However, cornering speed keeps the lap average exceptionally high. Suzuka is the purest technical speed circuit in the lower half of this ranking.
Read our guides to car handling, the racing apex and clean and dirty air.
10. Interlagos — A Fast Average on a Short Lap
Interlagos has only 15 corners, a long uphill full-throttle section and several flowing bends. Its representative qualifying average is about 230.56 km/h.
Interlagos looks compact and technical on a map.
Nevertheless, several sections allow sustained speed.
The Main Straight Begins Before the Finish Line
Drivers accelerate from Junção through the uphill Subida dos Boxes.
The road bends but remains effectively full throttle. That long run protects average speed.
The Reta Oposta Adds Another Acceleration Zone
Curva do Sol leads onto the back straight.
Drivers then brake heavily for Turn 4. Therefore, strong traction and efficient deployment matter twice each lap.
The Infield Contains Flowing Corners
Ferradura and Laranjinha require speed and balance.
They prevent the middle sector from becoming completely slow. A stable front axle maintains momentum.
Altitude Reduces Drag
Interlagos sits near 800 meters above sea level.
Thinner air lowers downforce and drag. Teams can use more wing while retaining useful straight-line speed.
Why Interlagos Ranks Tenth
Several slow corners reduce the average below Suzuka.
However, its short lap and long full-throttle climb keep it above traditional stop-start circuits.
11. Montreal — Fast in a Straight, Slower on Average
Circuit Gilles-Villeneuve links long acceleration zones with chicanes and hairpins. It rewards power and low drag, but repeated braking lowers its full-lap average.
Montreal’s 4.361-kilometer layout is a classic stop-start circuit.
Cars accelerate hard, brake, change direction and accelerate again.
The Back Straight Creates High Top Speed
Drivers leave the hairpin and accelerate toward the final chicane.
The long run rewards electrical deployment and aerodynamic efficiency. Overtake battles often develop there.
Chicanes Reduce Average Speed
The car must slow and ride curbs repeatedly.
Therefore, Montreal can produce a large speed-trap number without matching Silverstone’s lap average.
Braking Stability Is Essential
Rear grip becomes vulnerable under heavy deceleration.
A low-downforce setup can make the car nervous. Drivers adjust brake balance as fuel load changes.
The Wall of Champions Punishes Exit Errors
The final chicane controls the lap.
Carrying too much speed sends the car toward the outside wall. A conservative exit loses time down the pit straight.
Why Montreal Ranks Eleventh
Its representative average is around 223.5 km/h.
The track is fast in its acceleration phases, but the hairpin and chicanes reduce the full-lap figure.
12. Zandvoort — Banking Keeps a Technical Lap Fast
Zandvoort uses banking, elevation and flowing corners to preserve momentum. Its representative qualifying average is roughly 222.58 km/h.
Zandvoort is not a low-downforce circuit.
Its speed comes from corner flow and banking rather than very long straights.
Banking Supports Higher Corner Speed
Hugenholtz and Arie Luyendijk use steep banking.
The angle adds support and opens several racing lines. Drivers can accelerate while the car remains loaded.
The Dunes Create Elevation
The circuit rises and falls constantly.
Compression adds grip in some corners, while crests reduce it elsewhere. Drivers preserve momentum through the changes.
The Lap Is Short and Busy
There is little straight-line recovery.
However, repeated fast corners keep the average above many longer stop-start layouts.
Wind Changes the Speed Profile
The coastal location exposes the circuit to gusts.
A headwind can support front grip while increasing drag. A tailwind does the opposite.
Why Zandvoort Ranks Twelfth
Its benchmark sits just below Montreal.
Nevertheless, the lap feels faster because barriers, gravel and narrow track edges remain close.
Top-Speed Outliers: Why Baku and Mexico Are Different
Valtteri Bottas reportedly reached 378 km/h during 2016 practice at Baku. Mexico City has also produced race speeds above 360 km/h because altitude reduces aerodynamic drag.
Peak speed and average speed answer different questions.
Baku and Mexico City demonstrate the difference better than any other circuits.
Baku’s Straight Is Exceptionally Long
The final sector connects several flat-out bends with the waterfront straight.
A car can remain at full throttle for a very long period. Slipstream then adds another speed gain.
Bottas Reached a Reported 378 km/h
Williams reported that Bottas hit 378 km/h during 2016 practice.
Formula 1 later used that figure in its official speed history. It remains one of the sport’s most famous track speeds.
Baku’s Castle Section Reduces Average Speed
The old-city section contains narrow, slow corners.
Repeated 90-degree turns also require major braking. Consequently, the full-lap average stays far below the top-ranked circuits.
Mexico Uses Thin Air
The Autódromo Hermanos Rodríguez sits more than 2,200 meters above sea level.
Thin air reduces wing load and drag. Cars use large wings but still achieve very high straight-line speed.
Mexico’s Slow Stadium Section Pulls Down the Average
The Foro Sol complex creates spectacle and low-speed corners.
Therefore, Mexico can lead a speed trap while posting a modest average lap speed.
Why Speed-Trap Leaders May Qualify Poorly
A car may use less wing than its rivals.
That choice increases straight-line speed but reduces corner grip. The fastest trap result can belong to a slower overall car.
Average Speed vs. Top Speed: The Difference
| Measurement | What It Shows | What Changes It | Best Example |
|---|---|---|---|
| Average lap speed | Speed across the complete circuit | Corner type, braking, straights and setup | Monza |
| Speed-trap figure | Peak speed at one timing point | Slipstream, wind, deployment and gearing | Baku or Mexico |
| Race average | Average across the full Grand Prix | Pit stops, traffic, flags and tire management | Monza 2025 |
| Corner speed | Velocity through a selected turn | Downforce, grip, wind and tire condition | Silverstone or Suzuka |
Average Speed Rewards Flow
A circuit remains high in the ranking when braking zones are limited.
Fast corners also help. Therefore, Silverstone can outrank a track with a longer straight.
Top Speed Rewards Time at Full Throttle
The car needs enough distance to overcome drag.
A long straight, tow and electrical deployment create the highest reading.
Race Average Includes Interruptions
Pit stops and tire management reduce the number.
Safety Cars and rain can lower it dramatically. That is why Verstappen’s 2025 Monza record was exceptional.
What Makes an F1 Circuit Fast?
Long straights, fast corners, limited heavy braking, low aerodynamic drag and strong corner exits raise average speed. Wind, altitude, tire grip and energy deployment alter the final result.
Long Straights
A Formula 1 car needs distance to reach maximum velocity.
Acceleration weakens as drag rises with speed. Therefore, the final part of a long straight reveals aerodynamic efficiency.
Fast Corners
Silverstone and Suzuka show why corner speed matters.
A track maintains average speed when drivers lift only slightly or stay flat. Slow hairpins erase the benefit of a previous straight.
Low Drag
Smaller wing angles reduce resistance.
However, the car also loses cornering grip. Teams seek the lowest drag that still preserves useful tire and braking performance.
Strong Traction
Every straight begins at the previous corner exit.
Wheelspin delays acceleration. Consequently, rear suspension and differential behavior affect top speed several seconds later.
Power and Electrical Deployment
Modern Formula 1 combines combustion and electrical power.
Deployment strategy decides where maximum output appears. A driver may save energy before using it on the longest straight.
Altitude
Thin air reduces drag but also reduces cooling and downforce.
Turbocharging recovers much of the power loss. Mexico therefore produces large speed-trap numbers with high-downforce wings.
Wind
A tailwind can increase ground speed on a straight.
However, it reduces aerodynamic load under braking. A headwind does the opposite and can strengthen the slipstream effect.
Tire Grip
A soft tire improves acceleration and corner speed.
Yet overheating creates sliding. The fastest track condition usually appears when grip rises without excessive temperature.
Our guides to ERS, brake balance and torque cover the mechanical side.
Why Low-Downforce Setups Increase Top Speed
Reducing rear-wing angle cuts aerodynamic drag, so the car accelerates longer and reaches a higher speed. The tradeoff is weaker braking stability and lower corner grip.
Downforce and drag are linked.
A larger wing creates more grip but also pushes harder against the air.
Monza Uses Circuit-Specific Wings
Teams often manufacture special low-drag rear wings.
The upper elements become flatter and smaller. This design would be unsuitable for Monaco or the Hungaroring.
Low Downforce Changes Braking
The tires receive less aerodynamic load.
Therefore, drivers brake earlier and manage lockups carefully. Rear stability can become difficult in chicanes.
Curbs Become More Dangerous
A low-downforce car has less grip to absorb movement.
Hitting a curb can start a slide. Suspension compliance becomes important at Monza’s chicanes.
Slipstreaming Becomes Tactical
Drivers seek a tow in qualifying.
However, traffic can ruin preparation. Teams must balance the speed gain against dirty air and timing risk.
How 2026 Active Aero Changes F1 Speed
Straight Mode is the 2026 low-drag Active Aero configuration. Front and rear wing elements change angle in designated high-speed sections, reducing drag and increasing straight-line speed.
The 2026 regulations changed how Formula 1 cars create speed.
Traditional DRS ended after 2025. Active Aero now moves front and rear elements together.
Corner Mode Creates Downforce
The wings use a higher-load position through corners.
Drivers receive grip where the car needs it. The system then changes for approved straights.
Straight Mode Reduces Drag for Every Driver
Traditional race DRS normally required a one-second gap.
Straight Mode does not serve only the attacker. Every driver can use it in designated dry sections.
Moving Both Wings Protects Balance
Old DRS changed the rear wing only.
Active Aero adjusts front and rear elements. Therefore, the car maintains a more controlled aerodynamic balance.
Overtake Mode Uses Electrical Energy
An eligible chasing driver receives additional deployment options.
The advantage now comes from energy rather than one rear-wing flap. Drivers can choose where to use it.
Fast Circuits Magnify Energy Management
Monza, Jeddah, Baku and Las Vegas contain long deployment sections.
Using energy too early can leave the battery depleted. Consequently, the fastest trap is not always the fastest race strategy.
Historical Records Still Matter
The new cars may set different benchmarks.
However, weather and tire rules affect direct comparisons. Hamilton’s 2020 Monza lap remains the established average-speed record as of this update.
2011–2025 Speed Tool
- Rear-wing DRS flap
- Race eligibility linked to one-second detection
- Low drag only inside DRS zones
- Attacker received the aerodynamic advantage
2026 Speed Tools
- Front and rear Active Aero
- Straight Mode available to every car
- Overtake Mode adds electrical deployment
- Energy strategy shapes the attack
Fastest Qualifying Lap vs. Fastest Race Lap
Qualifying and race laps serve different purposes.
Therefore, their records should not be compared without context.
Qualifying Uses Low Fuel
The car carries enough fuel for an out-lap, push lap and return.
Lower mass improves braking, acceleration and corner speed.
Qualifying Uses Maximum Tire Performance
Drivers prepare the tire for one decisive lap.
They accept more temperature and degradation than during a race stint.
Race Laps Include Strategic Limits
Drivers protect tires, fuel and temperatures.
Traffic also reduces clean-air performance. Consequently, the fastest race lap is usually slower than pole.
Late-Race Fastest Laps Can Be Misleading
A driver may stop for fresh tires near the finish.
The low-fuel car then produces a rapid lap without representing normal race pace.
Race Average Is a Third Measurement
The full event includes pit stops and slower opening laps.
Verstappen’s 2025 Monza record average remains notable because it covers the entire Grand Prix.
Which F1 Track Is Fastest in Each Category?
| Speed Category | Leading Circuit or Record | Reason |
|---|---|---|
| Highest qualifying average | Monza | 264.362 km/h, Hamilton 2020 |
| Fastest street circuit | Jeddah | Qualifying averages above 250 km/h |
| Fastest race average | Monza | 250.706 km/h, Verstappen 2025 |
| Reported peak track speed | Baku | 378 km/h, Bottas 2016 practice |
| Fastest corner sequence | Silverstone | Maggots, Becketts and Chapel |
| Fastest technical flow | Suzuka | Esses, Dunlop, Spoon and 130R |
| Fastest short lap | Red Bull Ring | Only 10 corners and long full-throttle climbs |
| Fastest high-altitude trap | Mexico City | Thin air dramatically reduces drag |
Common Myths About the Fastest Formula 1 Tracks
“The Track With the Highest Top Speed Is the Fastest Track”
False. Baku can lead the speed trap while losing large amounts of time in slow corners.
Monza leads the full-lap average.
“Long Straights Always Produce a High Average”
False. Slow hairpins and chicanes can erase the gain.
Silverstone proves fast corners can matter more than straight length.
“Low Downforce Always Makes a Car Faster”
False. Less wing improves straights but weakens braking and cornering.
The correct setup minimizes total lap time.
“A Fastest Lap Is the Same as Pole Position”
False. Fastest lap usually refers to the race.
Pole comes from qualifying and normally uses lower fuel.
“Active Aero Gives Only the Chasing Driver More Speed”
False in 2026. Every car can use Straight Mode in designated dry sections.
Overtake Mode supplies the eligible chasing advantage.
“Monza’s Record Must Fall Every Year”
False. Regulations, tires and conditions change.
A newer car can be faster in some areas yet slower across the complete lap.
Fastest F1 Tracks Ranked: FAQs
What is the fastest F1 track?
Monza is the fastest by sustained average speed. Hamilton’s 2020 pole lap averaged 264.362 km/h.
What is the fastest street circuit in Formula 1?
Jeddah is the fastest street circuit, with representative qualifying averages above 250 km/h.
Which F1 track has produced the highest top speed?
Baku produced a reported 378 km/h practice speed for Bottas in 2016. That is a peak figure rather than a lap average.
How were the fastest F1 tracks ranked?
The ranking uses representative dry qualifying laps on current layouts, calculated from official circuit length and lap time.
Conclusion: Monza Is Fastest, but Speed Has Several Meanings
The fastest F1 tracks ranked list begins with Monza.
Its advantage comes from sustained speed rather than one isolated straight.
The circuit measures 5.793 kilometers.
It contains only 11 corners.
Drivers remain at full throttle for about 80 percent of the lap.
Therefore, braking events occupy a smaller share of the total time.
Hamilton’s 2020 pole remains the central benchmark.
The 1:18.887 lap averaged 264.362 km/h.
No other established Formula 1 qualifying lap has exceeded that average.
The 2025 Italian Grand Prix strengthened Monza’s record.
Verstappen won at an average of 250.706 km/h.
That became the fastest World Championship Grand Prix average.
Jeddah ranks second.
Its 27 corners do not behave like conventional street turns.
Many are shallow and flowing.
Hamilton’s 2021 pole averaged almost 254 km/h.
Walls and restricted visibility make that number feel even more extreme.
Jeddah remains Formula 1’s fastest street circuit.
Albert Park takes third.
The revised layout removed a slow chicane.
Wider corners also increased flow.
Consequently, modern qualifying averages sit near 253 km/h.
The circuit now belongs among Formula 1’s genuine speed venues.
Silverstone ranks fourth.
Its speed comes through corners.
Abbey begins the lap quickly.
Copse rewards confidence.
Maggots and Becketts change direction under major lateral load.
Chapel controls the Hangar Straight.
Therefore, aerodynamic stability produces the average.
Spa ranks fifth.
Its 7.004-kilometer lap is the calendar’s longest.
Eau Rouge and Raidillon preserve momentum toward Kemmel.
Pouhon adds sustained high-speed load.
Blanchimont keeps the final sector fast.
However, La Source and the final chicane reduce the average.
The Red Bull Ring ranks sixth.
Only 10 corners interrupt its short lap.
Long uphill acceleration zones dominate the first half.
Fast downhill bends shape the second half.
As a result, representative averages approach 247 km/h.
Lusail follows in seventh.
Its broad corners maintain medium-high speed.
Las Vegas ranks eighth because its long straights are interrupted by slow city corners.
Suzuka ranks ninth through technical flow.
Its speed comes from the Esses, Dunlop, Spoon and 130R.
Interlagos takes tenth.
The uphill full-throttle run protects its lap average.
Altitude also reduces drag.
Montreal ranks eleventh.
It is fast in a straight but loses average speed through chicanes and a hairpin.
Zandvoort completes the list through banking and flowing elevation.
Baku explains why the ranking cannot use speed traps alone.
Bottas reportedly reached 378 km/h there in 2016 practice.
Yet the castle section contains slow corners.
Therefore, Baku’s complete-lap average remains much lower than Monza’s.
Mexico City creates a similar contrast.
Thin air reduces drag at high altitude.
Cars can exceed 360 km/h.
However, the stadium section and technical corners reduce the average.
Average speed measures the complete circuit.
Top speed measures one point.
Race average includes pit stops, traffic and flags.
Corner speed measures a different skill again.
Each number tells a useful story.
The 2026 cars add another layer.
Active Aero moves front and rear wing elements.
Straight Mode reduces drag for every driver in approved sections.
Overtake Mode adds an electrical advantage for eligible chasing cars.
Energy management now shapes peak speed more directly.
Nevertheless, circuit geometry remains decisive.
Long straights need strong exits.
Fast corners need downforce and confidence.
Heavy braking needs stability.
Wind and altitude change the available grip.
Tires decide how much of the theoretical speed a driver can use.
That is why Monza remains the clearest answer.
It asks the car to minimize drag across almost the whole lap.
It also preserves momentum through fast bends.
The result is Formula 1’s greatest sustained speed.
Jeddah may feel more intense.
Baku may show a higher trap number.
Silverstone may be faster through difficult corners.
However, Monza still owns the fastest complete lap average.
Sources and Fact-Checking
This article was checked against official Formula 1 and FIA material available on July 24, 2026. Benchmark averages were calculated from official circuit lengths and qualifying lap times. The ranking is World of Speed editorial analysis. This is a static source list with no interactive verification feature.