How Fast Do Formula 1 Cars Go? Top Speed, Acceleration & Records Explained
372 km/h race-day peaks. 0–60 mph in under 2.6 seconds. Around 1,000 horsepower from a 1.6-litre engine. Here is exactly how fast an F1 car really goes — and why the numbers alone don’t tell the whole story.
How Fast Do Formula 1 Cars Go? Top Speed, Acceleration & Records Explained
372 km/h peaks, 0–60 mph in 2.6 seconds, ~1,000 hp from 1.6 litres. Every number, explained.
A Formula 1 car reaches around 360–375 km/h (224–233 mph) in race conditions. The official record, set by Valtteri Bottas at Monza in 2016, stands at 372.5 km/h (231.4 mph). That is fast enough to cover a kilometre in under ten seconds.
However, raw top speed is only one part of the picture. What truly separates an F1 car from everything else on four wheels is the combination of acceleration, braking, and cornering speed — and the 1,000 hp hybrid power unit that makes all three possible. This article covers every dimension of Formula 1 speed: the numbers, the physics behind them, and how a modern F1 car compares to IndyCar, NASCAR, MotoGP, and road cars.
Formula 1 cars reach a top speed of approximately 360–380 km/h (223–236 mph) in race conditions. The official race-speed record is 372.5 km/h (231.4 mph), set by Valtteri Bottas at Monza in 2016. F1 cars accelerate from 0 to 100 km/h in around 2.6 seconds and complete a 0–300 km/h sprint in roughly 8.5 seconds. A modern F1 power unit produces around 1,000 horsepower from a 1.6-litre V6 turbocharged hybrid engine.
What Is the Top Speed of a Formula 1 Car?
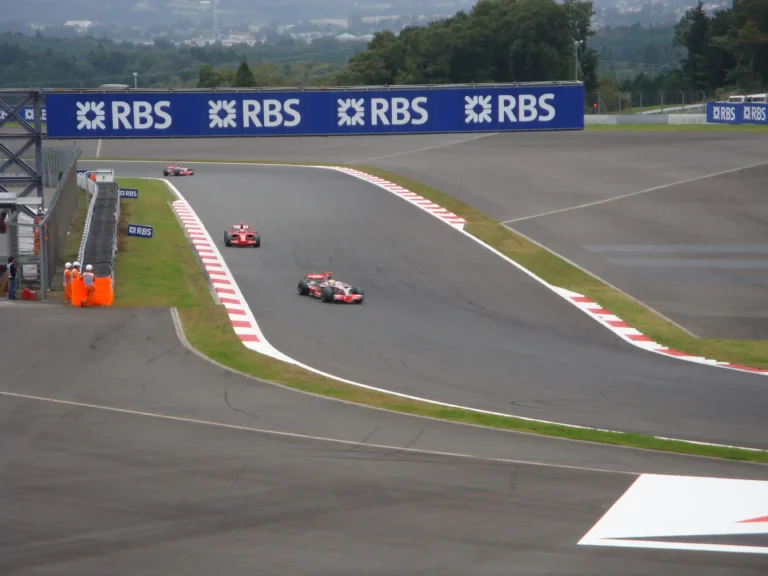
The answer depends on conditions. In a standard race, on a circuit with a long enough straight, a 2025–2026-era Formula 1 car reaches around 360–375 km/h (224–233 mph). Monza, with its ancient banked layout, consistently produces the highest readings of any round on the calendar. However, the Baku City Circuit and Las Vegas Strip Circuit also see exceptional straight-line speeds, with the long Boulevard section in Baku regularly generating speeds above 350 km/h.
The highest officially recorded race speed in Formula 1 history is 372.5 km/h (231.4 mph). Valtteri Bottas achieved it driving a Mercedes-AMG W07 Hybrid at the 2016 Italian Grand Prix at Monza. In qualifying and controlled testing conditions, the numbers go higher — Honda achieved a speed run of 400 km/h (248 mph) in 2006 during a straight-line test in a modified BAR 007, though that is not a race event and the car ran without downforce.
The Autodromo Nazionale Monza sits in a royal park near Milan. Its layout rewards low-downforce setups — teams run the smallest wings possible to reduce aerodynamic drag on the long straights. The Rettifilo Tribune main straight, where the speed record was set, is over 1 km long with a slight downhill gradient that adds extra velocity. Read our guide on what downforce is to understand how wing settings affect straight-line speed. External reference: Formula1.com — Italian Grand Prix.
What DRS Adds to F1 Top Speed
DRS — the Drag Reduction System — opens a flap in the rear wing when a driver is within one second of the car ahead on designated DRS zones. This reduces aerodynamic drag and adds approximately 10–15 km/h (6–9 mph) of additional straight-line speed. Therefore, in DRS zones at Monza, a car that would normally top out at 345 km/h might reach 358 km/h or beyond. To understand the full mechanics, our DRS explained guide covers exactly how the system works and why it is controversial.
Furthermore, it is worth understanding that F1 engineers actively trade top speed for cornering grip. A car set up for maximum straight-line velocity would be dangerously slow through corners. Consequently, the Monza setup — which produces those 372 km/h readings — is unique to Italy. The same car at Monaco might only reach 280 km/h because the tight street circuit demands much higher downforce for the corners. Slipstream effects further complicate the picture: drivers behind another car gain additional speed from reduced air pressure, which is why passing is often easier on straights despite the defending driver also using DRS.
F1 Car Acceleration: 0 to 100, 200, and 300 km/h
This is where Formula 1 cars genuinely separate themselves from everything else. A modern F1 car reaches 100 km/h (62 mph) from a standing start in approximately 2.6 seconds. That is comparable to the fastest production hypercars in the world. However, where an F1 car becomes truly extraordinary is at higher speeds — from 100 to 200 km/h, it takes roughly another 1.9 seconds, a rate of acceleration that no road car can approach. The full 0 to 300 km/h sprint is done in around 8.5 seconds.
Moreover, acceleration alone misses the most impressive part of the performance story. An F1 car brakes from 300 km/h to zero in approximately 3.9 seconds, over a distance of roughly 65 metres. Drivers experience peak deceleration forces of 5–6G under heavy braking — more than five times the force of gravity pressing them forward into the harness. The combination of acceleration and braking means an F1 car’s kinetic energy changes more dramatically in a single lap than most road cars experience in a lifetime. For more on how these extreme forces feel to a driver, our G-force in F1 explainer gives the full breakdown.
Reached in approximately 8.5 seconds. The 0–100 km/h phase takes 2.6s. The 100–200 km/h phase takes a further 1.9s. Beyond 200 km/h, aerodynamic drag increases significantly, slowing the rate of gain.
Achieved in approximately 3.9 seconds over 65 metres. Drivers experience 5–6G of deceleration force. Carbon-carbon brake discs — glowing red-hot at up to 1,000°C — are key to this performance. Road car disc brakes would disintegrate under the same load.
| # | Speed Milestone | F1 Car Time | Best Road Car (Approx.) | Difference |
|---|---|---|---|---|
| 1 | 0 → 100 km/h (62 mph) | ~2.6 sec | Bugatti Chiron: 2.4s | Similar |
| 2 | 0 → 200 km/h (124 mph) | ~4.5 sec | Ferrari SF90: ~6.7s | F1 +2.2s faster |
| 3 | 0 → 300 km/h (186 mph) | ~8.5 sec | Koenigsegg Jesko: ~11.8s | F1 +3s faster |
| 4 | 300 km/h → 0 (braking) | ~3.9 sec / 65m | Road car: ~200m+ | F1 3× shorter |
Interestingly, a standard road car actually beats an F1 car from 0 to 30 km/h. The reason is traction. F1 cars have slick tyres with no tread pattern and enormous downforce, but at very low speeds there is insufficient aerodynamic load to push the tyres into the ground. Wheelspin is a real threat at race starts. As speed builds, the aerodynamic downforce — which increases with the square of speed — multiplies grip dramatically. Consequently, above 150 km/h, no road car can live with an F1 car’s acceleration in any direction.
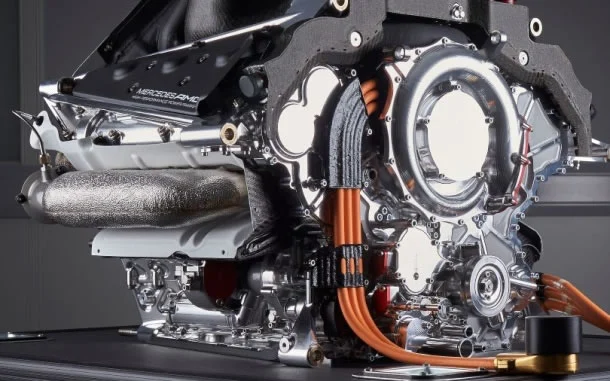
The Power Unit: How F1 Gets ~1,000 Horsepower from 1.6 Litres
The most remarkable engineering fact about a Formula 1 car is how it produces its power. A 1.6-litre V6 turbocharged engine — smaller in displacement than many family hatchbacks — generates approximately 850 horsepower from the combustion side alone, at a thermal efficiency approaching 50%. For context, a typical road car engine achieves around 30–35% thermal efficiency. The ERS — Energy Recovery System — adds a further 160 hp from the MGU-K (Motor Generator Unit – Kinetic), which harvests braking energy and deploys it as additional electric drive power. Total output is therefore around 1,000 hp (745 kW) combined.
However, the power is not available continuously. The MGU-K is limited to 120 kW of deployment by the regulations, and the ERS store holds a maximum of 4 MJ per lap. This means drivers and engineers must manage energy deployment strategically across every lap — deciding when to deploy the full power and when to harvest more for later. This energy management dimension is what makes F1 engineering so distinct from simply having a powerful engine. As the FIA’s technical regulations set out, these constraints are central to the modern power unit formula.
An F1 engine produces more power per litre of displacement than almost any other internal combustion engine ever built — including some jet turbines measured on the same metric.
What Makes the Engine Spin So Fast
A 2025-era F1 engine revs to approximately 15,000 rpm, which is about three times the redline of a typical road car engine. At those revs, the pistons travel up and down roughly 250 times per second. The engine requires exotic materials — titanium connecting rods, specially formulated lubricants, custom alloys — just to survive the mechanical stresses involved. Furthermore, the turbocharger pressurises the air intake to multiply the amount of fuel-air mixture entering the cylinders, which is why a 1.6-litre engine can produce power that would previously have required a 3.0-litre or larger unit. Our deep-dive on turbocharged versus naturally aspirated engines explains the fundamental difference in approach.
A current Formula 1 power unit costs approximately $10–15 million USD and must last for several race weekends under penalty rules — the engine regulations limit teams to a set number of power unit components per season. The extreme heat, vibration, and stress of racing at 15,000 rpm means that the same engine would destroy itself within hours in road car conditions. To understand the full cost picture, our article on how much a Formula 1 car costs breaks down where the money goes.
Formula 1 Speed by Circuit: Monza, Baku, Monaco, and More
No two Formula 1 circuits produce the same speeds. The variables are downforce level (wing settings), circuit altitude (thin air at Mexico City aids top speed), and the ratio of straight distance to corner distance. The table below shows representative peak speeds for key circuits — note that these vary by car, conditions, and year.
| # | Circuit | Country | Approx. Peak Speed | Notable For |
|---|---|---|---|---|
| 1 | Autodromo Nazionale Monza | Italy 🇮🇹 | 360–375 km/h | Speed Record |
| 2 | Baku City Circuit | Azerbaijan 🇦🇿 | 355–370 km/h | Long Boulevard |
| 3 | Las Vegas Strip Circuit | USA 🇺🇸 | 342–358 km/h | Long Strip Straight |
| 4 | Autodromo Hermanos Rodríguez | Mexico 🇲🇽 | 345–360 km/h | High Altitude +5 km/h |
| 5 | Circuit Gilles Villeneuve | Canada 🇨🇦 | 330–348 km/h | Wall of Champions |
| 6 | Silverstone Circuit | UK 🇬🇧 | 320–342 km/h | High-Speed Corners |
| 7 | Circuit de Monaco | Monaco 🇲🇨 | 280–295 km/h | Lowest Top Speed |
Mexico City deserves a special mention. The Autodromo Hermanos Rodríguez sits at 2,285 metres above sea level — the highest point on the entire F1 calendar. The thin air reduces aerodynamic drag, which means cars reach higher speeds on the straights for the same wing setting. However, the thin air also affects engine performance and cooling, so the engineering trade-off is more complex than simply “less drag equals more speed.”
At Monaco, F1 cars reach only 280–295 km/h because the circuit has almost no room for a genuine high-speed straight. Nevertheless, Monaco is considered the most demanding circuit on the calendar because the barriers are inches from the edge of the road at every point. The average speed around the lap is still 160 km/h (100 mph) — on a narrow public road through a city. Read about the 2026 Monaco Grand Prix for a sense of what the circuit demands. External reference: FIA Technical Regulations.
F1 Speed vs IndyCar, NASCAR, MotoGP, and Road Cars
The question “how fast is an F1 car compared to X?” is one of the most searched in motorsport. The answer depends heavily on what you are comparing. On an oval, an IndyCar actually matches or exceeds F1 top speeds. In a street circuit or road course context, F1 is faster than everything else. Here is the honest breakdown.
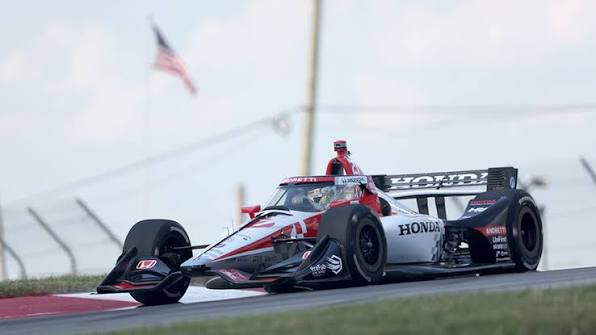
Formula 1 vs IndyCar Speed
This is the closest comparison in motorsport. On oval tracks, IndyCar is faster than Formula 1 — the 2.5-mile Indianapolis Motor Speedway produces qualifying speeds above 370 km/h (230 mph), and some oval top speeds approach 383 km/h (238 mph). However, on a road course, F1 dominates. A lap of the same road circuit in both series typically shows F1 10–15 seconds quicker, because F1’s aerodynamic grip far outperforms IndyCar through medium and high-speed corners. Our full IndyCar vs F1 comparison covers the full technical picture.
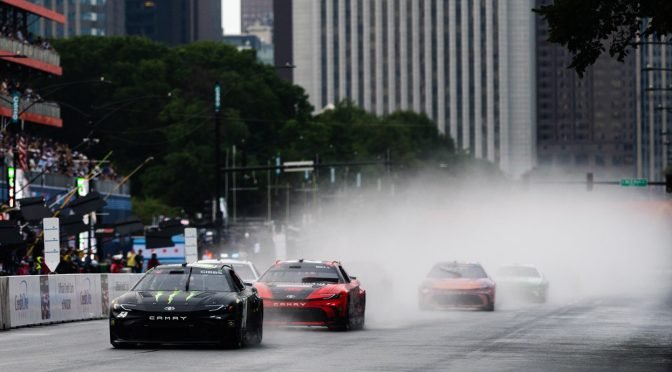
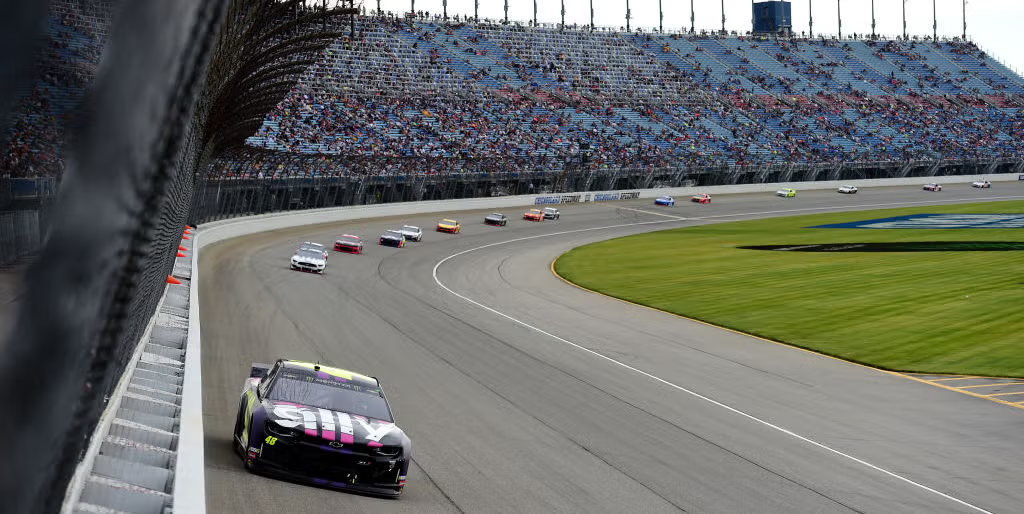
Formula 1 vs NASCAR Speed
NASCAR races primarily on oval tracks optimised for drafting and high-speed pack racing. At superspeedways like Daytona and Talladega, NASCAR cars reach around 320–328 km/h (200–204 mph) — but this is achieved with far less technical complexity. On a road course, an F1 car is categorically faster; F1’s cornering speed advantage is enormous. On an oval, the comparison is less relevant because the circuits are completely different types. Our piece on how fast NASCAR cars go explains the superspeedway dynamics in more detail.
Formula 1 vs MotoGP Speed
MotoGP bikes are genuinely close in straight-line speed to an F1 car — top speeds of around 355–360 km/h are achievable on fast circuits like Mugello in Italy. However, the difference emerges in cornering. An F1 car corners at speeds that would kill a motorcycle rider — a MotoGP bike cannot physically generate the same lateral G-forces as an F1 car with its four-wheel mechanical and aerodynamic grip. In lap time comparisons at the same circuit, F1 is typically faster. However, on public roads, a MotoGP bike would be more nimble in traffic. The head-to-head is genuinely interesting — our F1 speed context articles explore more comparisons.
| Series | Peak Speed | Road Course Lap Time* | Cornering G-Force | Engine Power |
|---|---|---|---|---|
| Formula 1 | 375 km/h | 1:21 (Barcelona) | 5–6G | ~1,000 hp |
| IndyCar | 383 km/h (oval) | 1:34 (COTA) | 3–4G | ~550–700 hp |
| NASCAR Cup | 328 km/h | N/A (ovals only) | ~2G (banking) | ~670 hp |
| MotoGP | 363 km/h | 1:55 (Mugello) | ~1.5G lateral | ~250 hp |
*Approximate lap times for comparison at equivalent circuits — not directly comparable across series
Why Are Formula 1 Cars So Fast? The Four Engineering Pillars
Four factors combine to make Formula 1 the fastest wheel-to-wheel racing category on road courses. Remove any one of them and the lap time collapses. Together, they produce a vehicle that operates at the absolute boundary of what physics and materials science allow on four wheels.
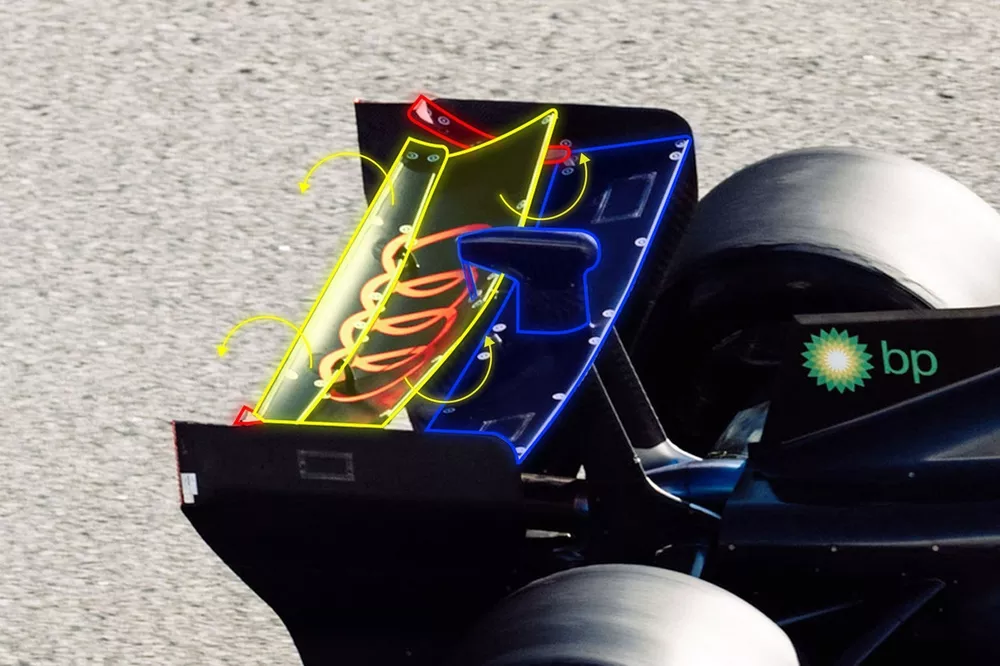
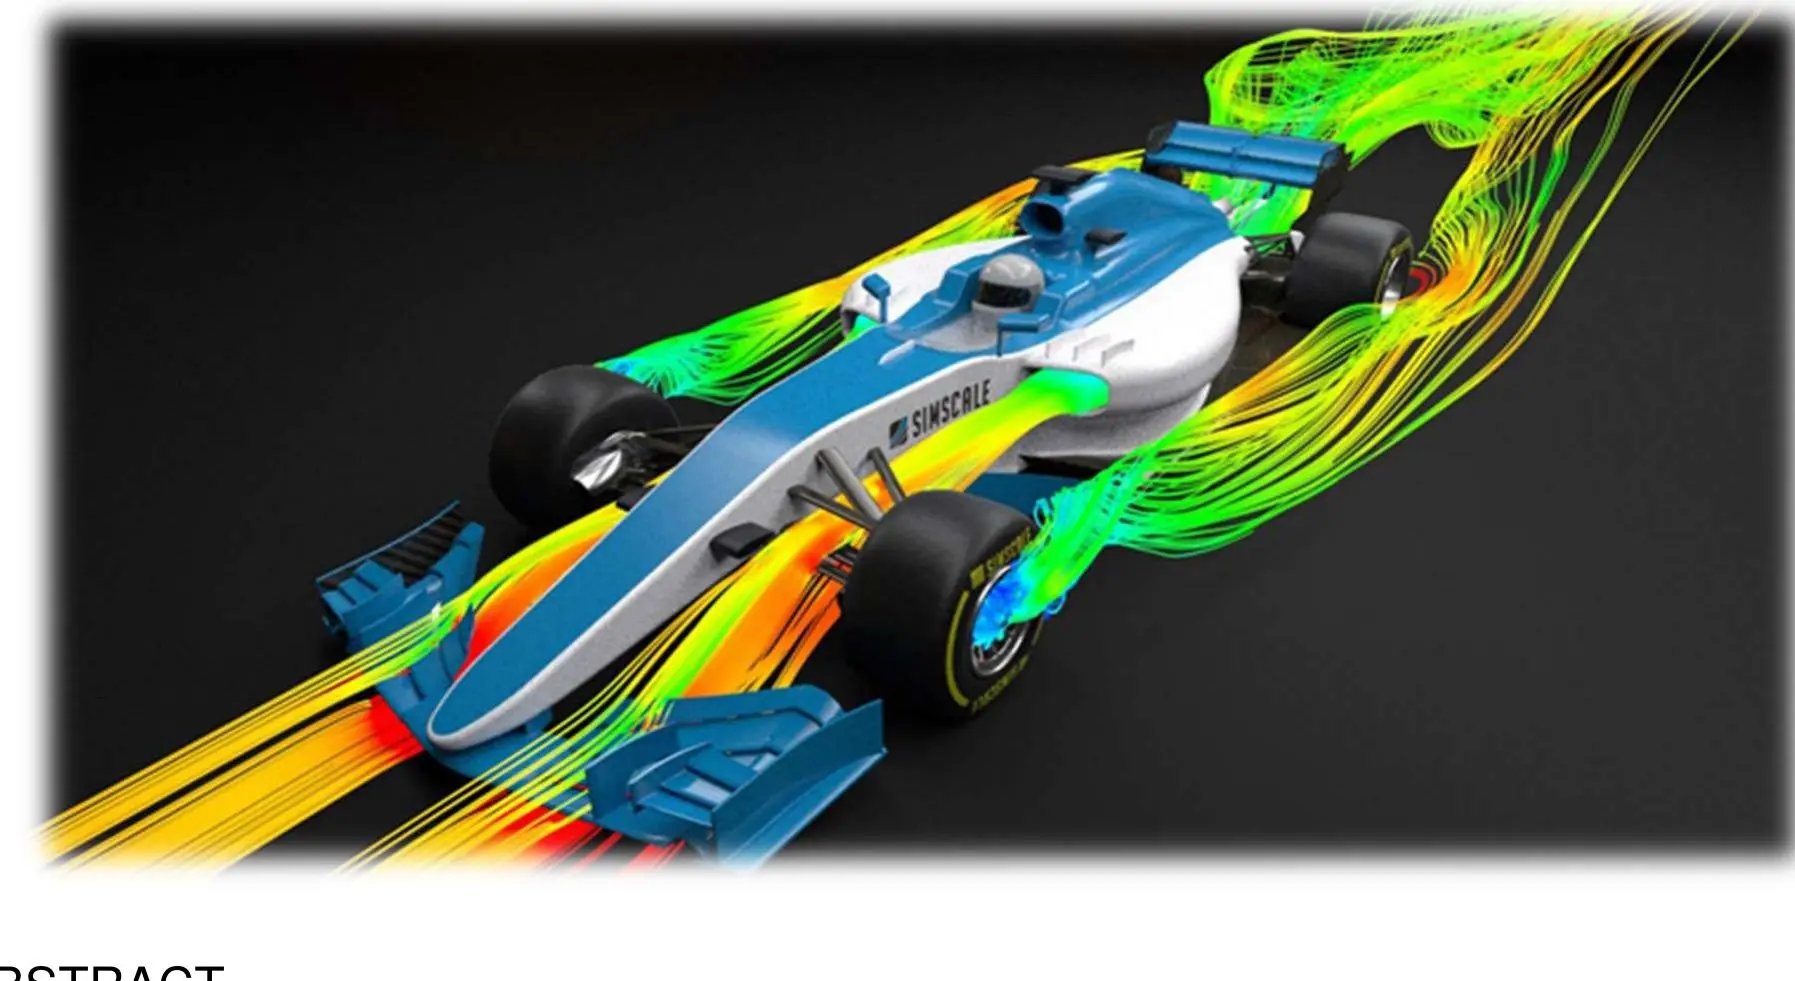
1. Aerodynamics and Downforce
A 2025 Formula 1 car generates more downforce than its own weight at typical race speeds. At 200 km/h, the car pushes down on the track with approximately double its static weight — meaning the tyres have double the grip they would at standstill. This is why F1 cars can corner at speeds that seem physically impossible. The front and rear wings, the underbody, the diffuser, and dozens of aerodynamic details all contribute to creating a blanket of low pressure under the car and high pressure above it. Furthermore, the ground effect — aerodynamic downforce from the floor — was reintroduced in the 2022 regulations and is now the dominant source of grip for modern cars. External reference: Racecar Engineering — Ground Effect Analysis.
2. Tyre Technology
Pirelli supplies slick tyres — completely smooth rubber with no tread pattern — for dry conditions. The entire tyre contact patch, roughly the size of a human hand for each of the four tyres, operates at an optimal temperature window of around 80–100°C. Inside that window, the tyre is almost adhesive in its grip. Outside it — too cold or too hot — and the tyre either slides or degrades rapidly. Managing tyre temperature across a stint is one of the defining skills of a modern F1 driver. The tyre compounds and strategy page explains how the soft, medium, and hard choices shape every race.
3. Weight — Or the Lack of It
A 2025 Formula 1 car weighs a minimum of 798 kg including the driver but excluding fuel — regulations set a floor, not a ceiling, because removing more weight becomes counterproductive for safety and tyre management. Every kilogram matters. A 10 kg reduction in car weight is worth approximately 0.3–0.4 seconds per lap, depending on the circuit. For context, the average road car weighs 1,400–1,600 kg. F1 achieves this by constructing the entire chassis, floor, and bodywork from carbon-fibre composites — the F1 monocoque weighs as little as 35 kg yet survives crash forces that would crumple steel.
4. Power-to-Weight Ratio
With approximately 1,000 hp and 798 kg, an F1 car achieves a power-to-weight ratio of around 1.25 hp per kg. A Ferrari 296 GTB road car — one of the most powerful sports cars you can buy — achieves roughly 0.85 hp per kg. A Bugatti Chiron Super Sport approaches 1.0 hp per kg. Consequently, F1’s ratio exceeds even the most exotic road cars by a meaningful margin. Furthermore, that power is delivered through a sophisticated ERS energy recovery system that harvests energy from braking and the turbocharger’s exhaust stream, then deploys it exactly when the driver needs it most.
Pole position at a typical F1 circuit represents the absolute theoretical minimum lap time under current conditions. On a high-speed circuit like Monza, the gap between pole and race pace is often very small — the car is already near its aero-optimised limit. At a circuit like Singapore, by contrast, a driver might be 15 seconds slower in the race than the theoretical minimum because of traffic, safety cars, and tyre management. What is pole position in racing? — our full explainer covers the significance beyond just qualifying.
Frequently Asked Questions
Sources & Further Reading
All speed figures, engine specifications, and performance data in this article are drawn from official FIA technical regulations, manufacturer technical briefings, and established motorsport publications. Key external references: